Understanding Table Exports vs the Reports Tool
Last updated: August 28, 2026
Housing.Cloud offers two ways to download data: table exports and creating reports with the reports tool. Table exports provide quick spreadsheet downloads using standard templates, while the reports tool gives you full control over fields and formatting.
Table exports do not reflect column customizations you have made to the table view. If you need specific fields or custom data organization, use custom reports instead.
Table exports are designed for quick snapshots of standard data. For specific reporting needs, navigate to Reports in the admin portal sidebar or go directly to /admin/reports.
Table Exports
Click the Export button at the top of list pages like Profiles (/admin/profiles), Residents (/admin/residents), or Applications (/admin/applicants) to download data as CSV or Excel. The system generates a file with a pre-defined set of standard columns.
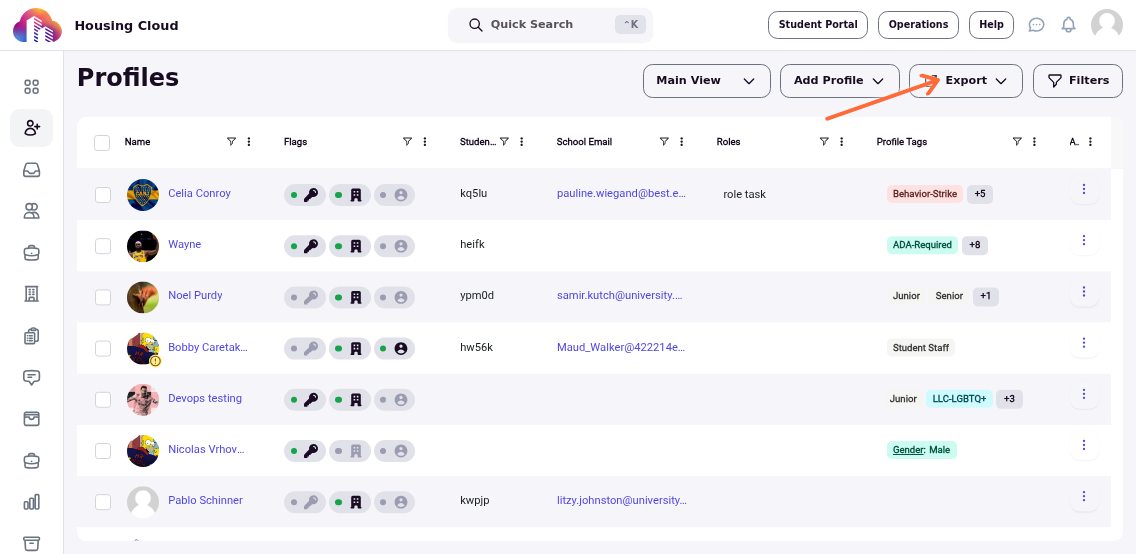
The export respects your current filters and search criteria, so you only get rows matching what you filtered for. However, the columns included in the export file are fixed and do not change based on which columns you have shown, hidden, or reordered in the table view.
What Gets Exported
Each export includes a specific standard set of fields for that data type. For example, profile exports always include name, email, student ID, class year, tags, and other core fields regardless of your table customization.
Other tables may export a different set of fields, as each table is related to different data types.
If you have added custom columns to your table view using the column selector, those customizations will not appear in the exported file. The export template is separate from your table display settings.
Column Customizations Are Not Exported
You can customize which columns appear in tables by right-clicking the table header and selecting columns to show or hide. You can also reorder columns by dragging headers left or right, and save these preferences as custom views.
These table customizations affect only what you see on screen. When you click Export, the system uses its own standard template rather than exporting your customized view. This means columns you added to the table may not appear in the export, and columns you hid may still be included.
When to Use Export Button
Use table exports when you need a quick download of standard data for simple tasks like printing contact lists, sharing basic information with other departments, or creating a backup before making changes.
Table exports work well when the pre-defined column set matches your needs. Apply filters before exporting to narrow the data to just the rows you want.
The Reports Tool
Navigate to Reports in the admin portal sidebar or go to (/admin/reports) when you need control over which fields appear in your output or when you need to combine data from multiple sources.
The reports tool lets you create reports with exactly the columns you need, add calculated fields, schedule automatic delivery via email, and export to CSV, Excel, or PDF.
Creating Reports
Open the Reports page from the admin portal sidebar. Browse existing reports or create new ones using the report builder.
In the report builder, select which data sources to include, choose specific fields to display, apply filters and grouping rules, and format the output. Save your report configuration to run it again later or schedule it to email automatically on a recurring basis.
Scheduled Reports
Reports can be scheduled to run daily, weekly, or monthly and deliver results via email. This eliminates the need to manually export data on a regular schedule.
Configure the email subject, message, recipient list, and file format when setting up a scheduled report. The system sends the report automatically at your specified frequency.
Quick Comparison
Table Exports: Fast, one-click download with standard columns; respects filters; no customization of fields; ideal for quick snapshots.
Reports Tool: Full control over fields and formatting; combine multiple data sources; schedule automatic delivery; build once, run repeatedly; ideal for recurring needs and specific data point correlation.