How to Access the Detailed Excel Occupancy Graph
Last updated: October 2, 2026
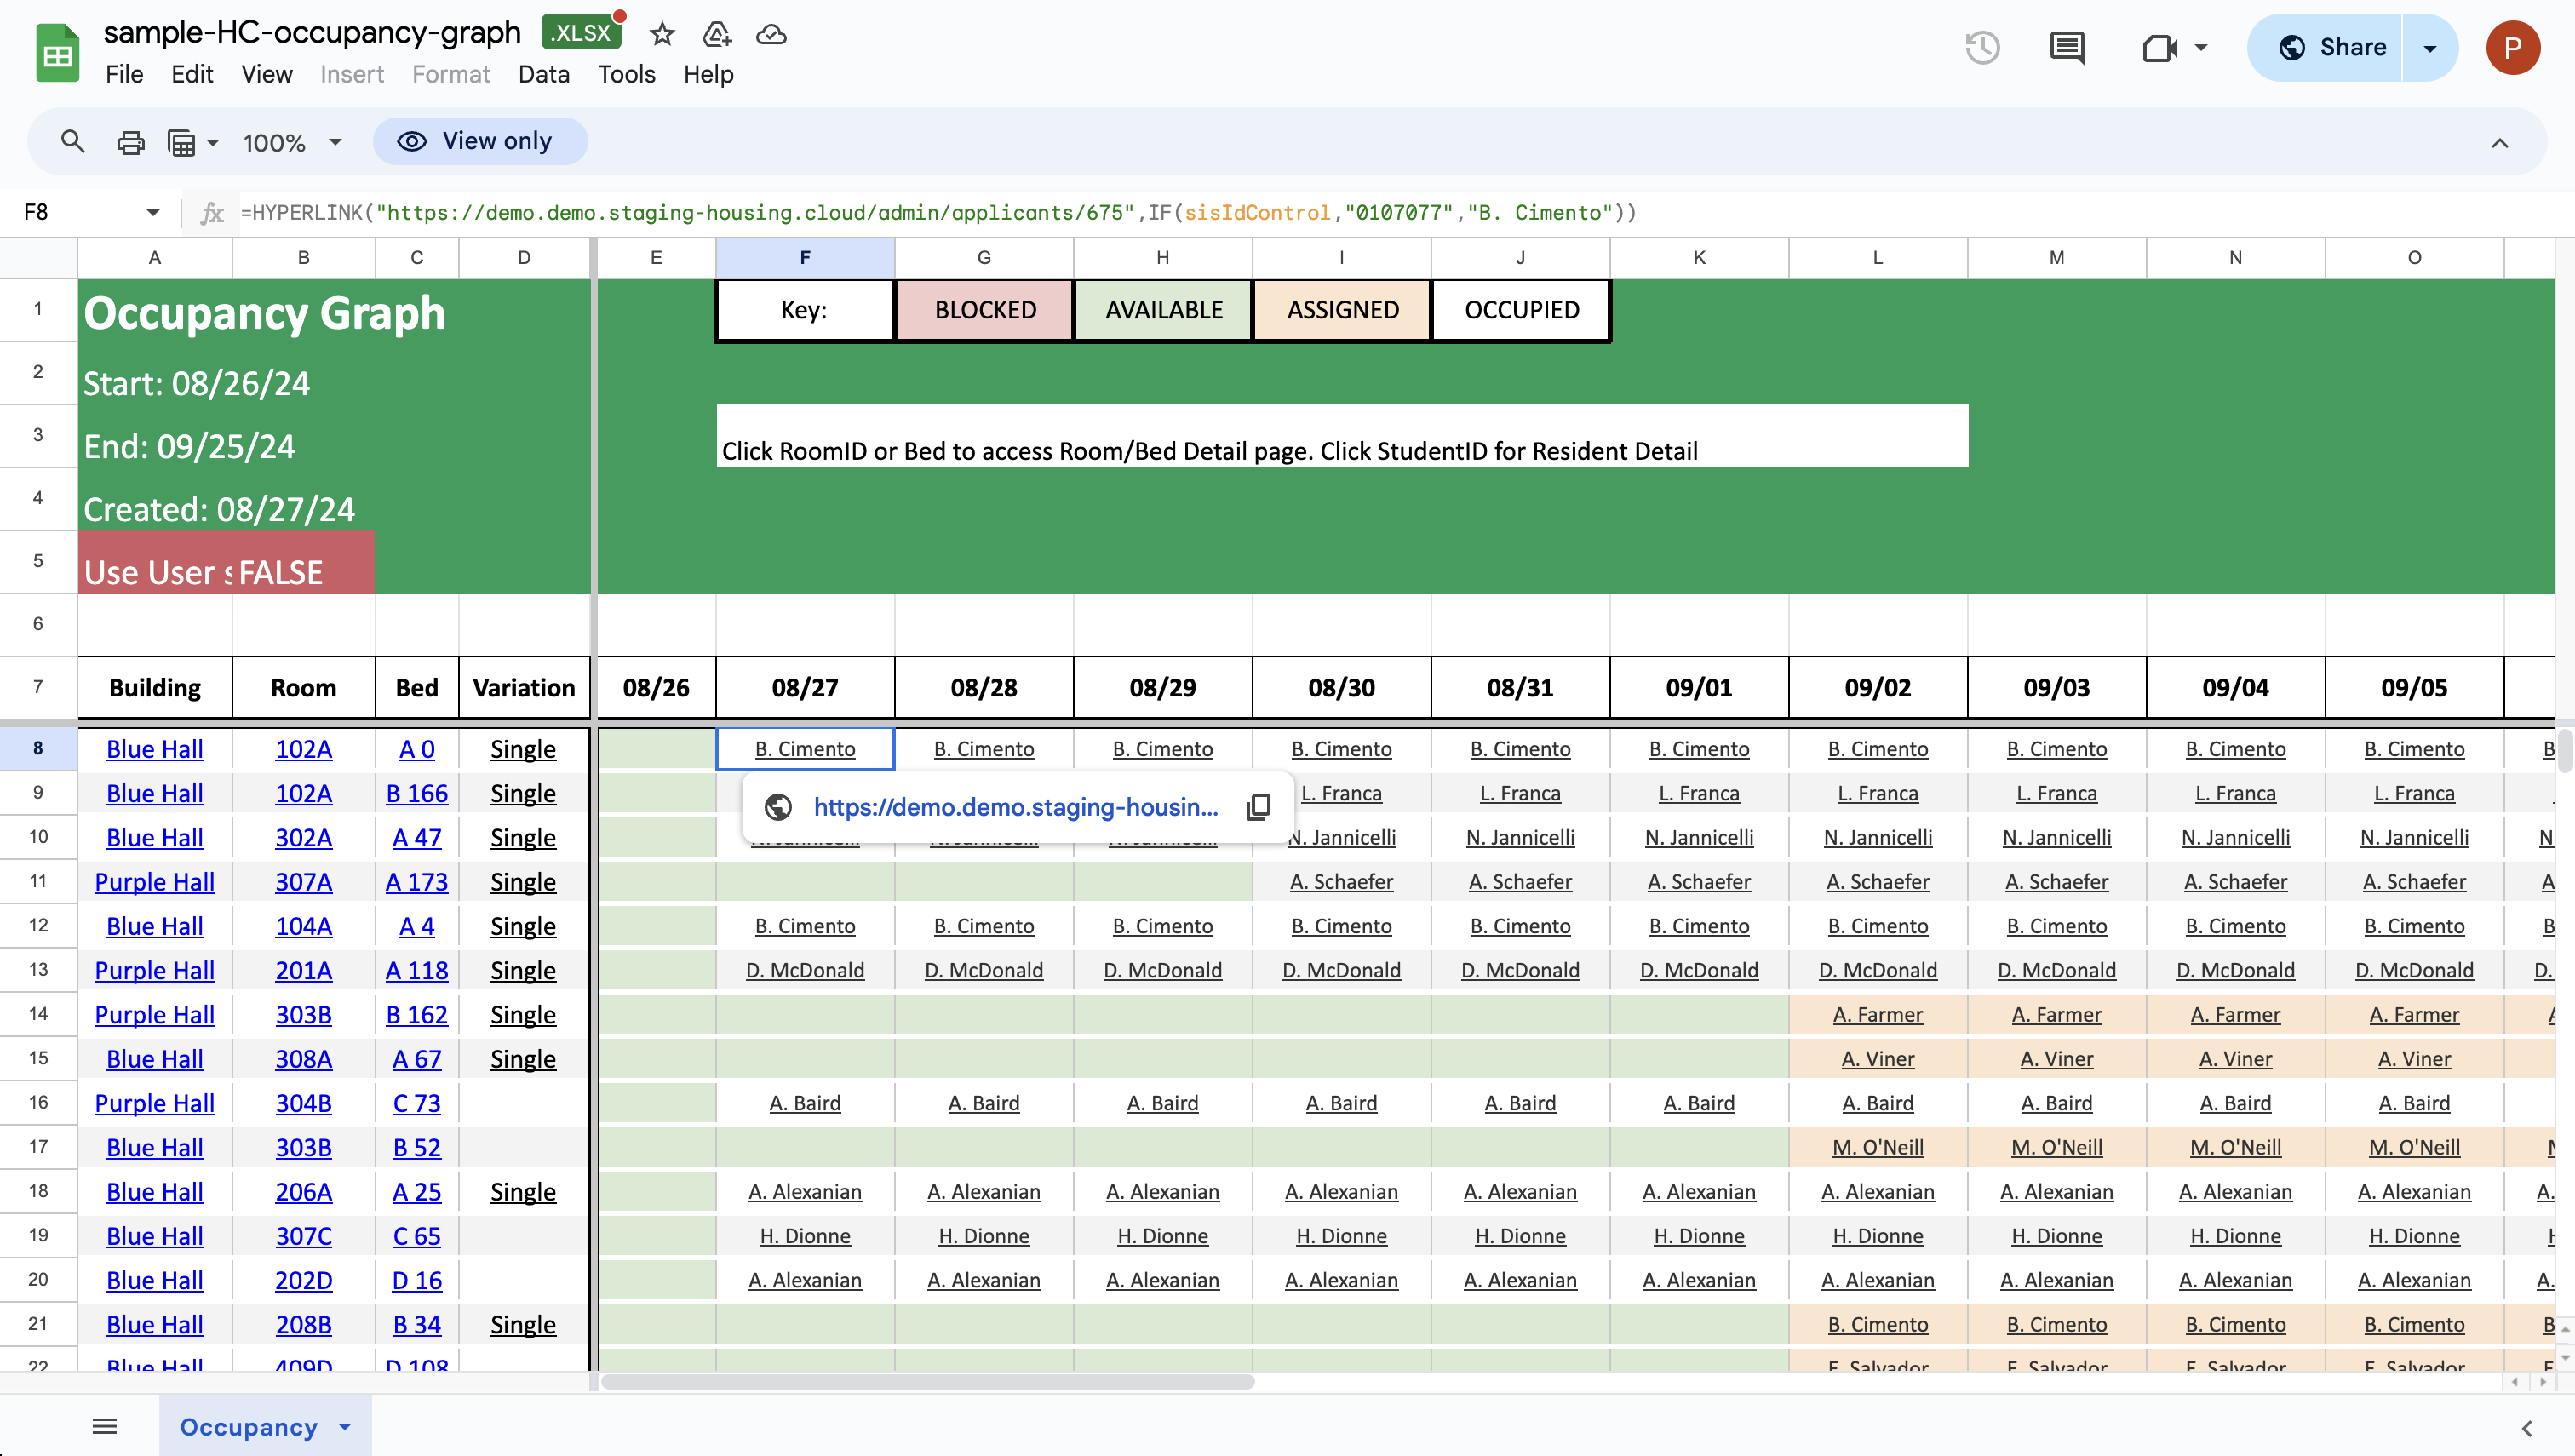
Housing.Cloud offers several versions of an Occupancy Graph to help you visualize, track, and manage room availability. Some are designed for use within our web platform, but one of the most detailed and useful graphs is available as a fully formatted Excel spreadsheet that looks like this:
Steps To Access the Detailed Excel Occupancy Graph
1. Click Inventory on the navigation panel.

2. Click View Occupancy Graph button. This option can be found under Buildings, Suites, Rooms and Beds however the graph view will always be based on room occupancy.

3. Choose Full Occupancy Graph from the button options

4. Click the Custom Date Range button and choose a date range to inspect


5. Apply filters if needed to refine your inventory occupancy view.
To apply filters, click Filters. The available filters are:
- General filters - Filter based on building, room, and bed types.
- Features - Filter based on tags.
- Search Individual - Filter based on a specific bed.

7. Once you have set a date range and any desired filters, click the export icon immediately beside the date range and choose Export Full Occupancy Spreadsheet to export the occupancy data into an Excel spreadsheet.


8. The occupancy graph Excel sheet is now downloaded and available on your local device. This is what it looks like: