The Satisfaction Dashboard and End-of-Week Report
Last updated: October 8, 2026
The Satisfaction dashboard shows how residents rated their closed requests. Read the scores and the written feedback, find the ratings that need a follow-up, and pull the numbers for your weekly report.
Before you start
You open the dashboard from the admin menu at Support → Satisfaction; the page address is /admin/tasks/satisfaction. You need the View task satisfaction ratings and dashboard permission.
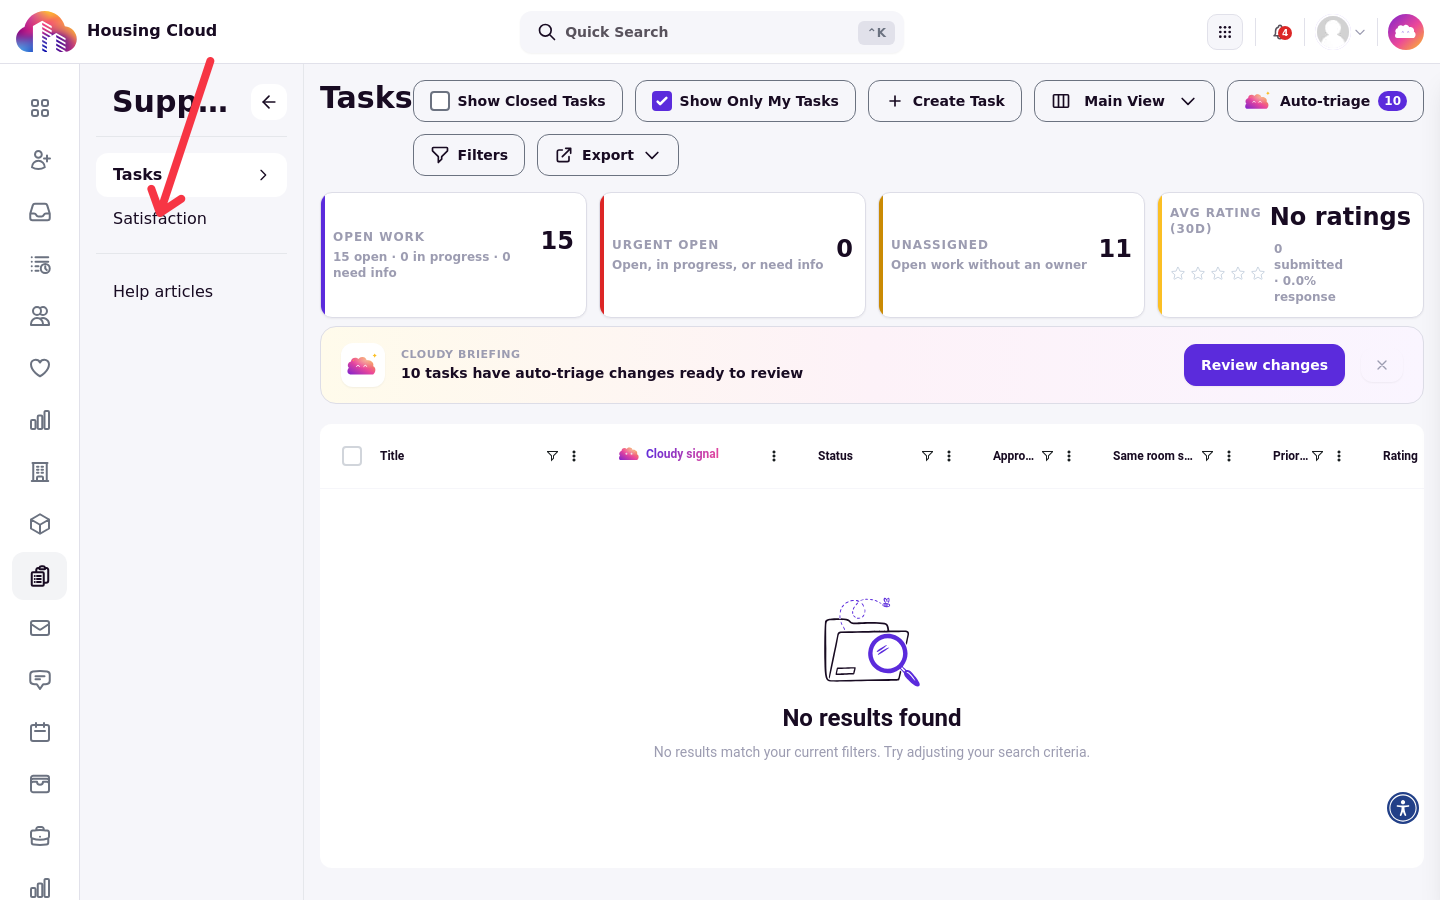
The dashboard shows the summary cards, the charts and Recent Ratings for the date range you select.
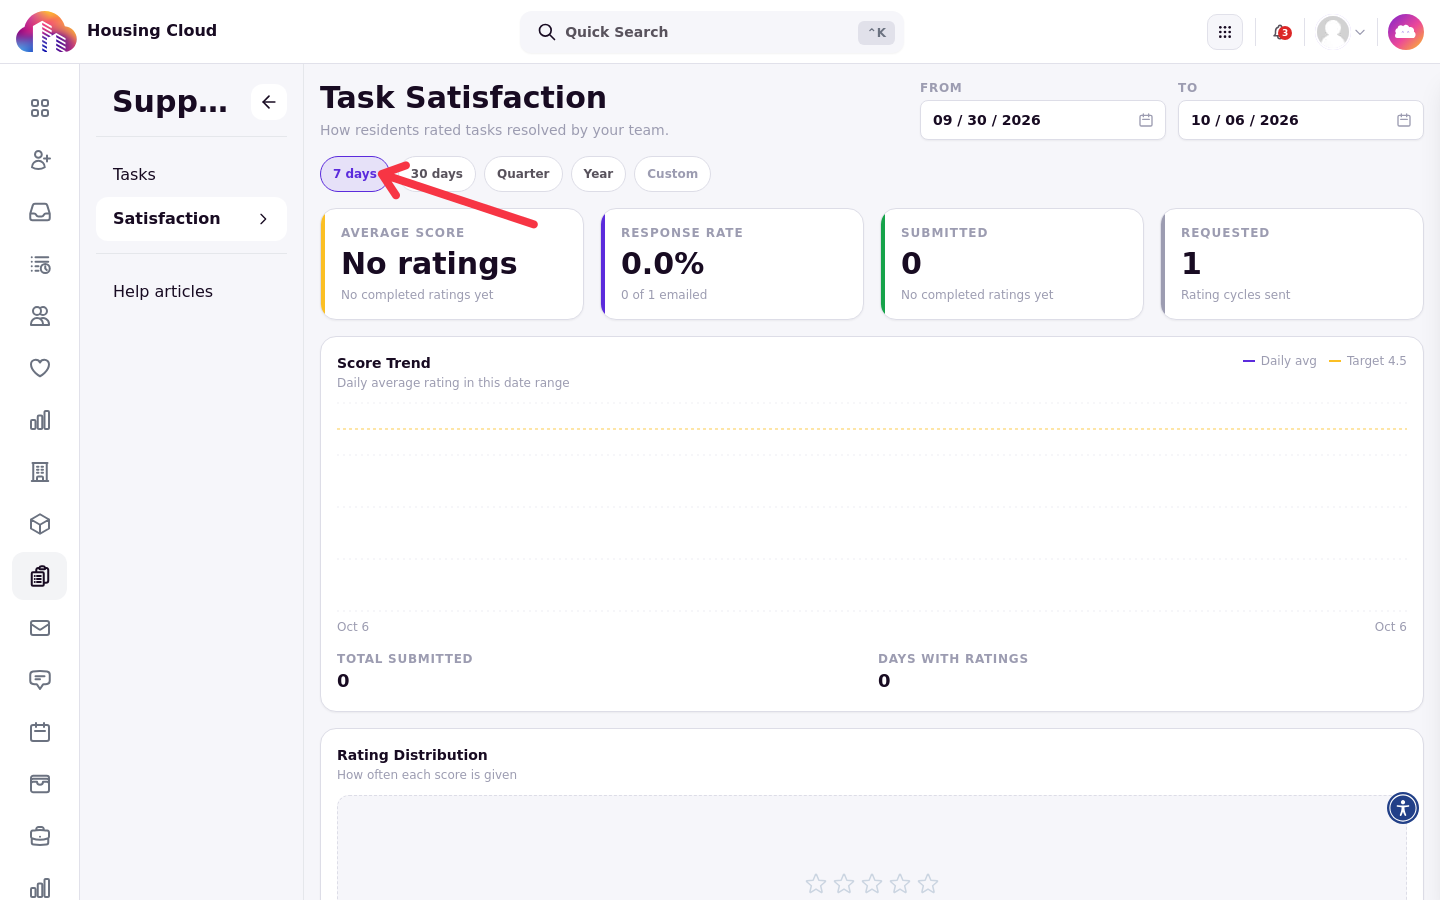
Choosing the date range
The dashboard covers 7 days, 30 days, Quarter or Year, or a From / To range you set yourself.
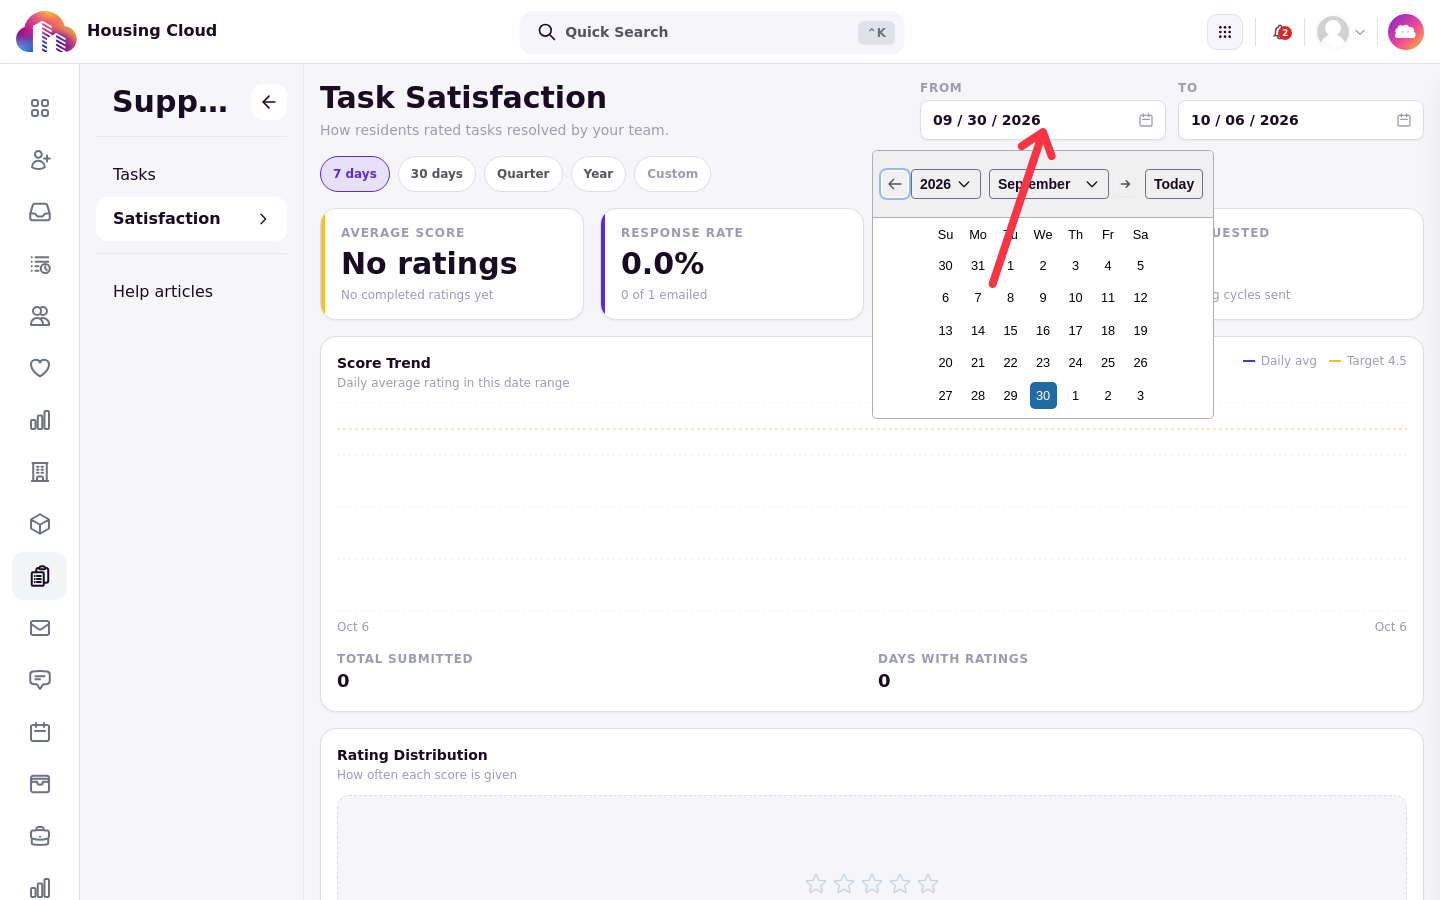
Ratings count in the week the request was closed, not the week the rating was submitted.
The summary cards
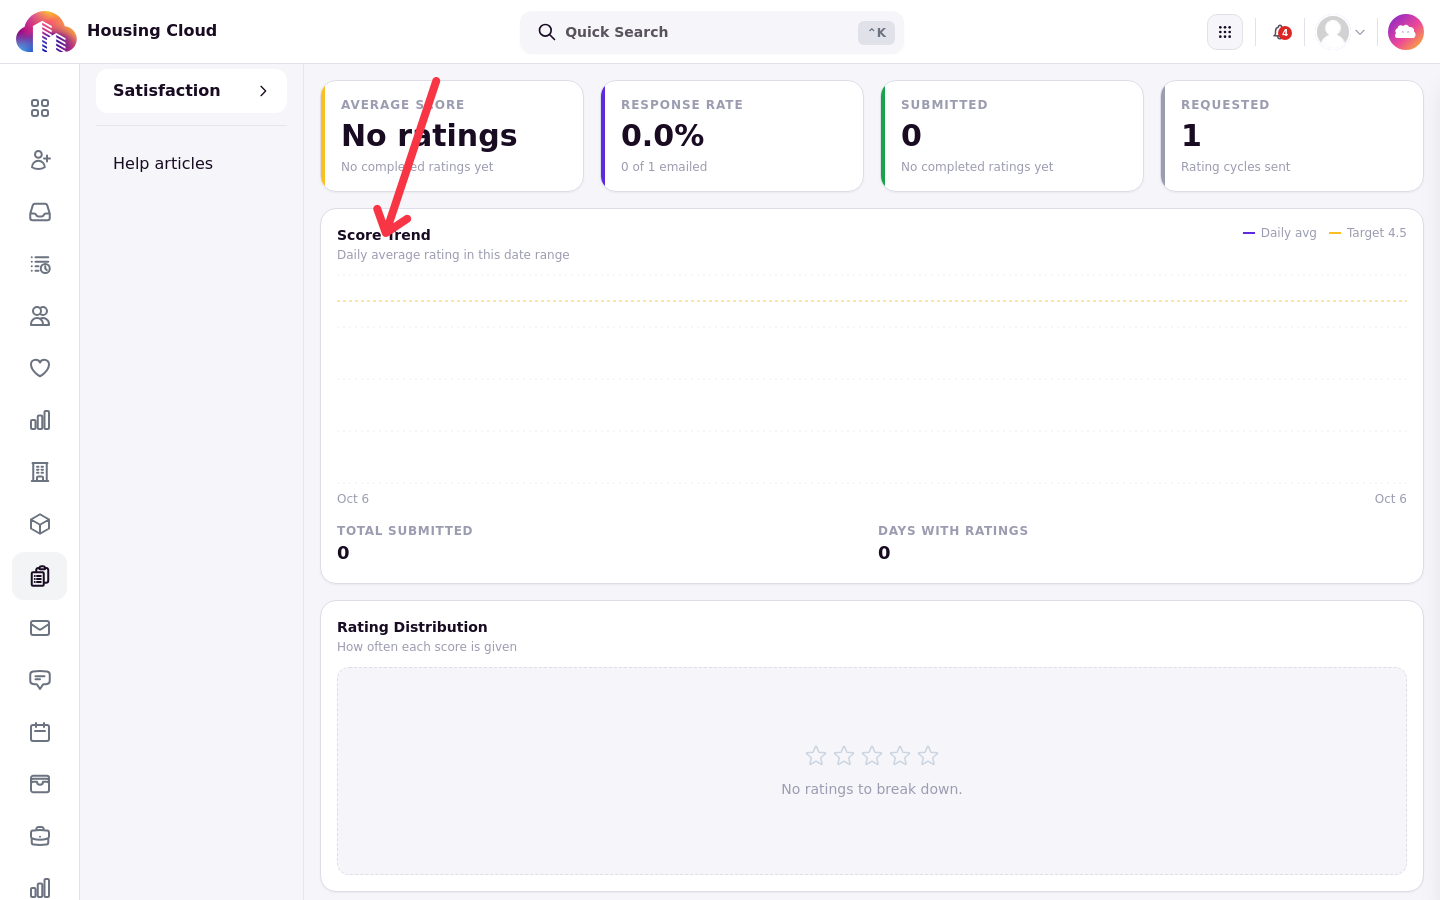
Four cards summarize the range: Average score, Response rate, Requested and Submitted.
The charts
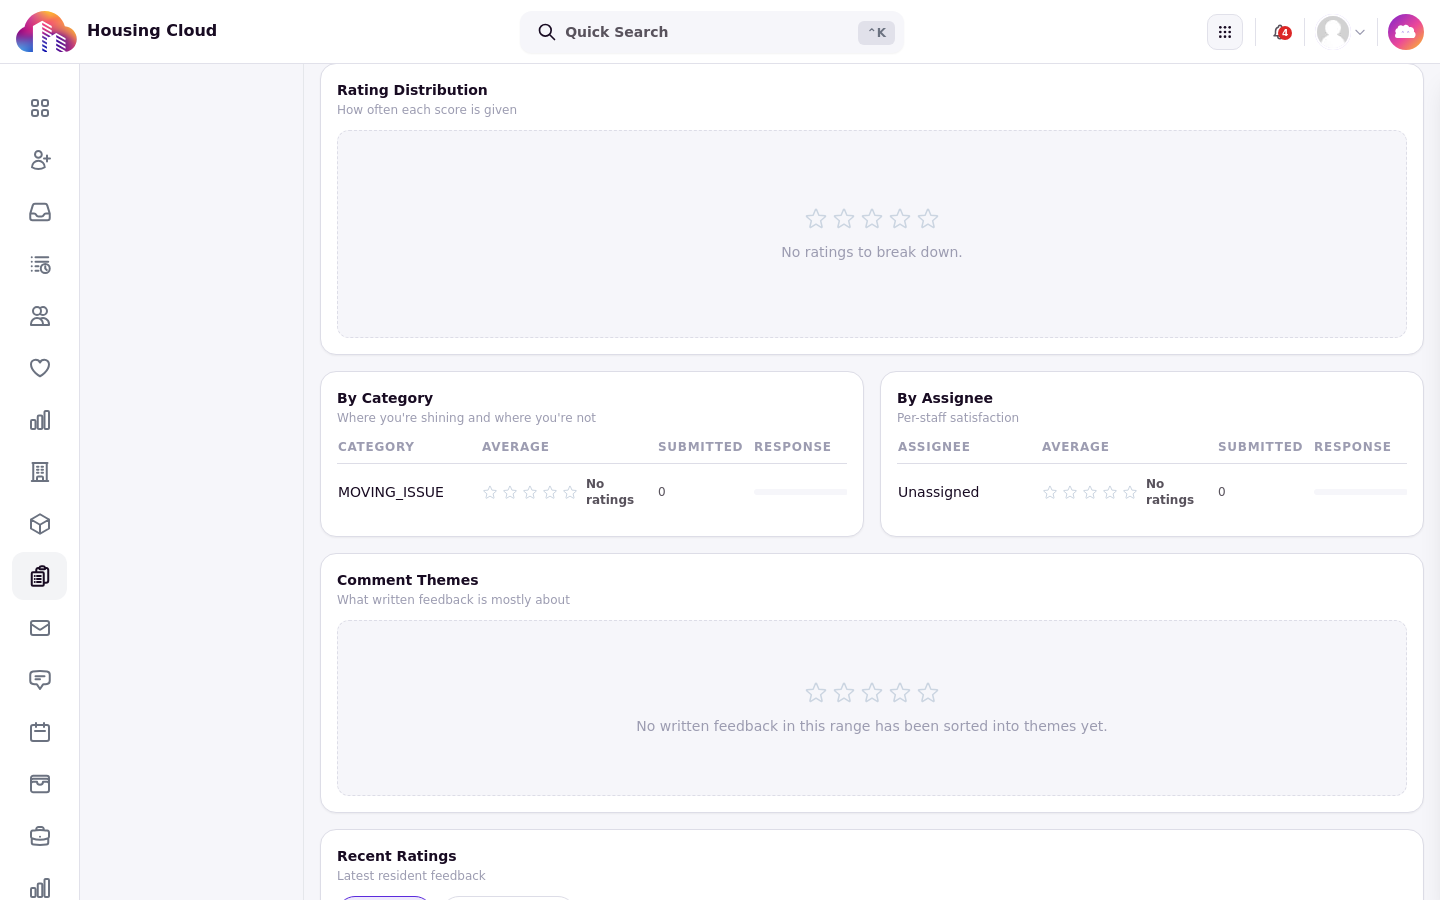
Four charts break the ratings down: Score Trend, Rating Distribution, By Category and By Assignee. Tasks with no assignee roll up as "Unassigned" on By Assignee.
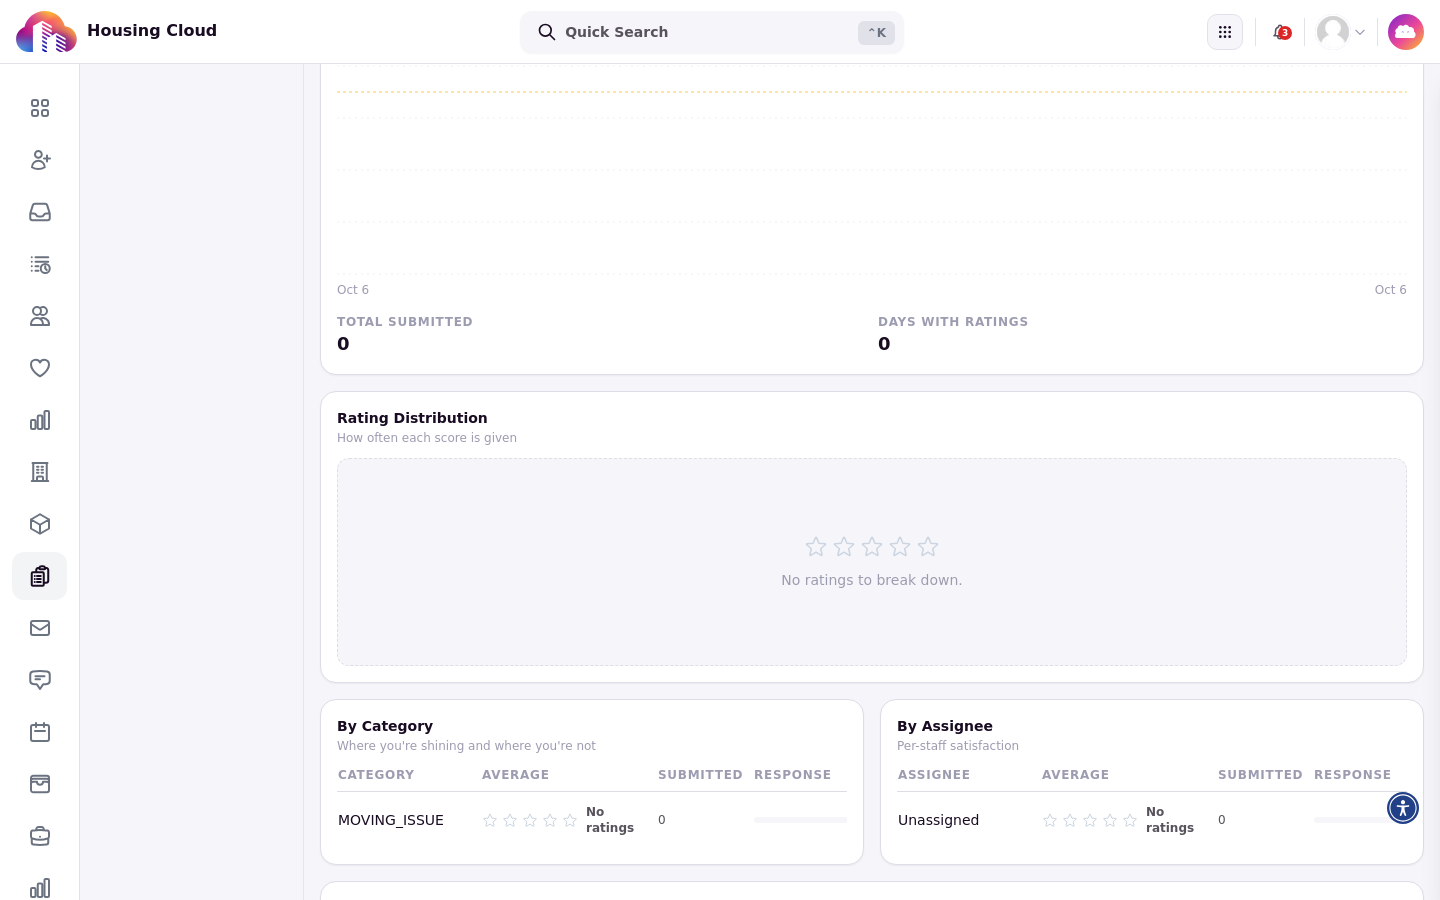
Score Trend plots the daily average rating over the date range, and Rating Distribution shows how often each score is given. With no ratings in the selected range, the charts stay empty.
Recent ratings
Recent Ratings lists the latest resident feedback. Each rating card shows the task title, who rated it and when, the star score out of 5, and the written comment, and the task title links to the task. Use the filter to switch between All ratings and Needs follow-up.
[SCREENSHOT 24-3: Recent Ratings with rating cards listed.]
Comment themes
Comment Themes sorts the written feedback into themes: Response time, Communication, Quality of work, Not resolved, Staff conduct, Policy or process, Praise and Other. The panel sits above Recent Ratings and appears only when comment triage is available on your account.
"Needs follow-up" means Cloudy thinks the problem is not fixed or the resident wants contact. Ratings on sensitive requests are never sent to Cloudy.
To see only the ratings that need a follow-up, set the filter on Recent Ratings to Needs follow-up; the filter appears together with Comment Themes.
[SCREENSHOT 24-5: A24/05-needs-follow-up.png — Recent Ratings filtered to "Needs follow-up".]
When the numbers refresh
The dashboard numbers refresh within an hour. A new rating refreshes them at once.
Ratings on the queue and the task page
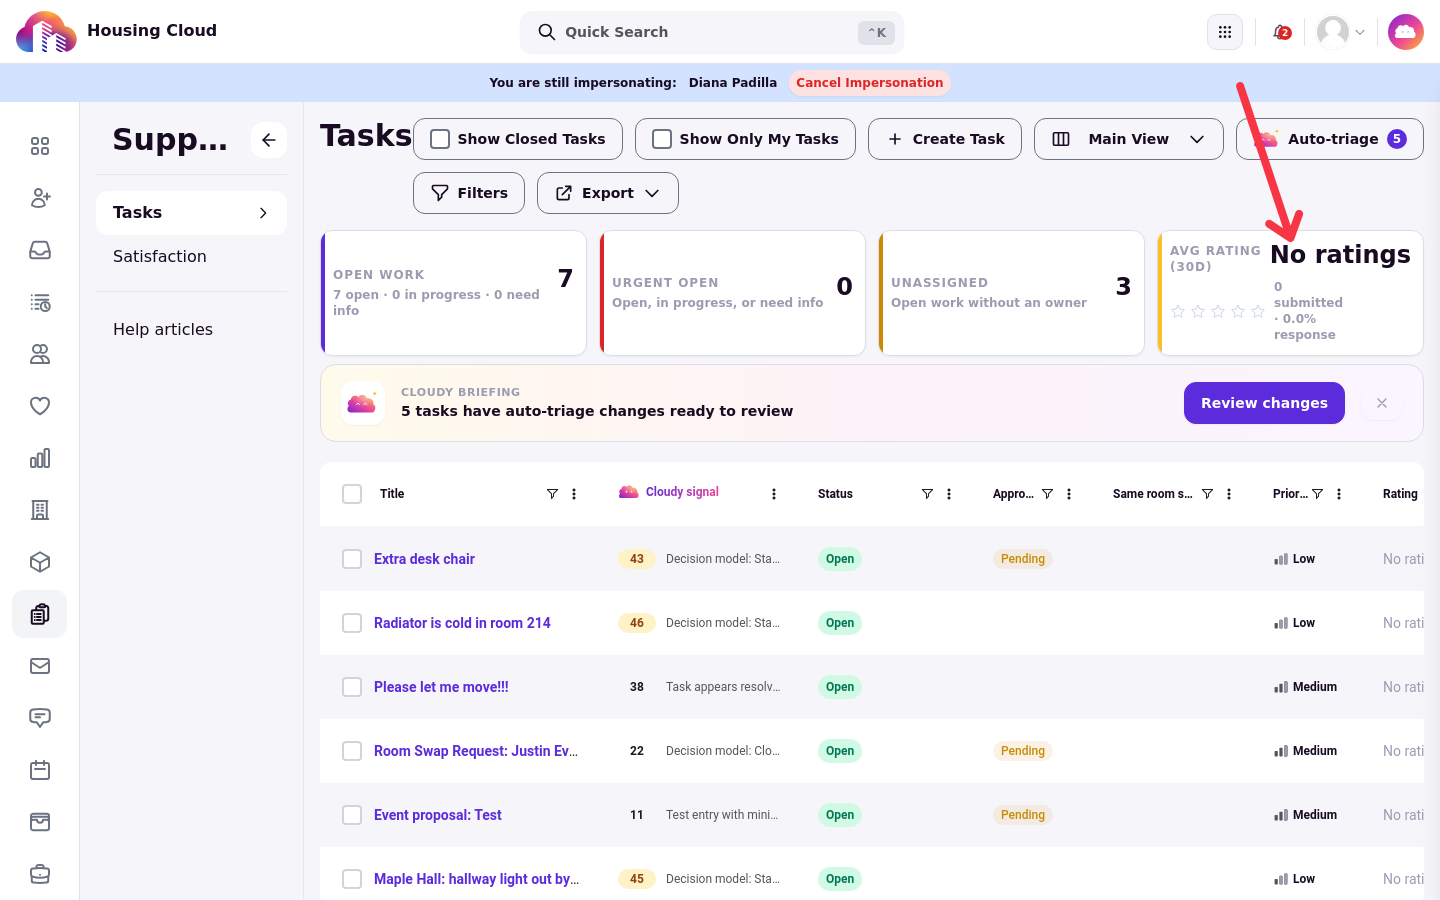
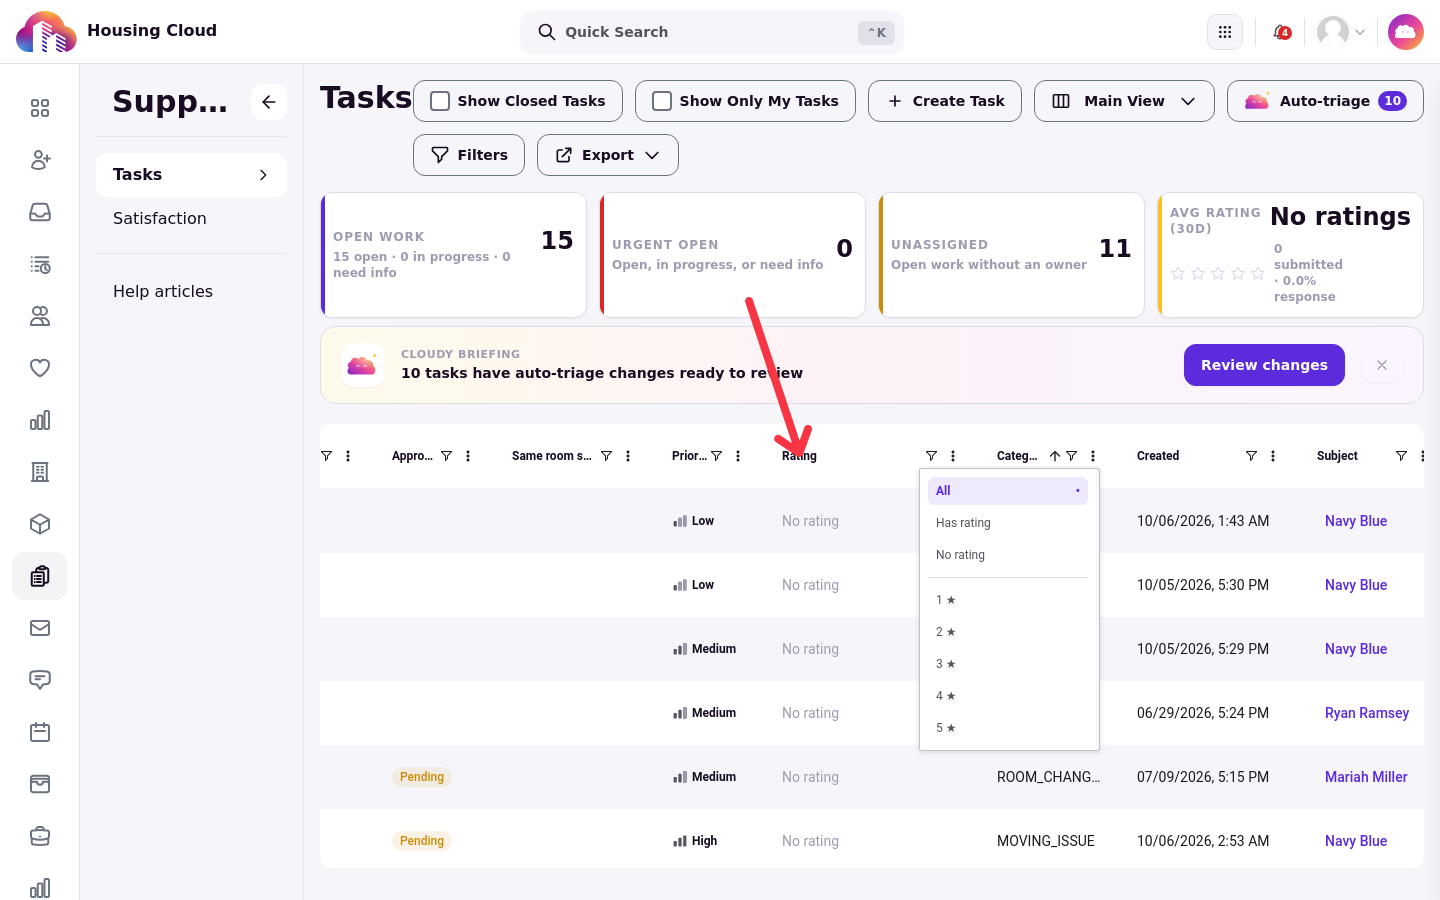
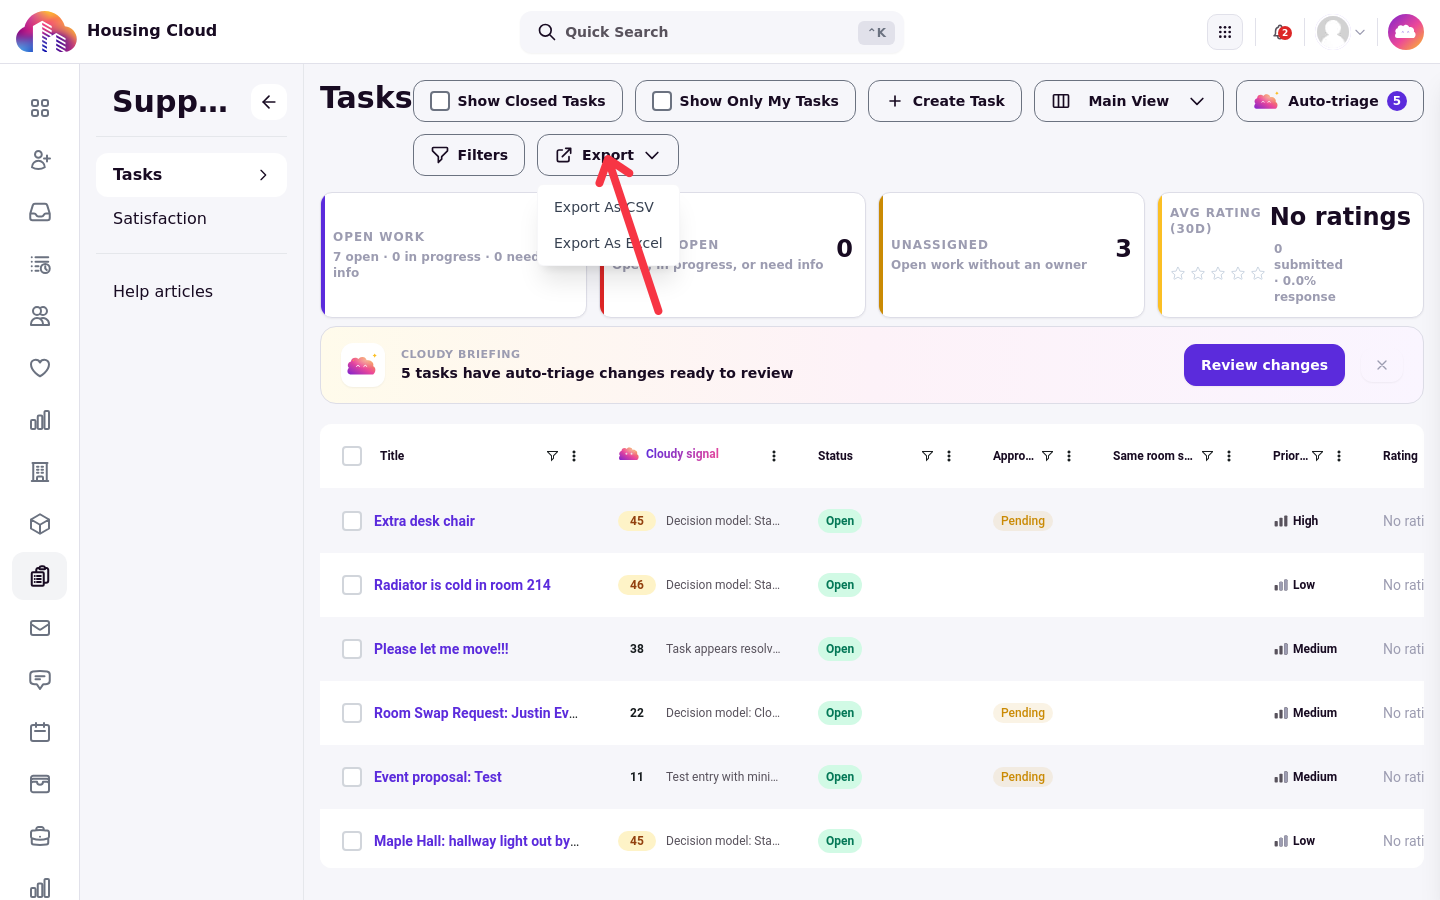
The Tasks queue shows ratings too: the Avg rating stat card covers the last 30 days, and the Rating column and its filter narrow the grid to rated, unrated or particular scores. On a task page, the rating card shows the score and the resident's comment. When there are no ratings yet, the Avg rating card shows no ratings.
The Rating column filter offers All, Has rating, No rating and each star score from 1 to 5.
Pulling the numbers for a report
For a report you can save, build a new report on Task Ratings in Reports. You can also export the queue filtered by Rating as CSV or Excel; the export runs in the background and you receive a notification when it is ready.
Following up on a rating
To follow up on a low rating, open the rating's task from Recent Ratings, read the rating card and the comment, then reopen the task and reply publicly so the resident sees your answer.
[SCREENSHOT 24-6: A24/06-rating-card.png — A task page with the rating card showing the score and the comment.]
The rating card stays on the task page after the task is reopened.
[SCREENSHOT 24-8: A24/08-reopened.png — A reopened task showing In progress.]
Good to know
The dashboard groups ratings by the date the request was closed. A rating submitted this week for a request closed last week counts in last week's numbers.
Numbers can lag up to an hour.
Requests filed on a resident's behalf, and tasks staff created themselves, never appear on the Satisfaction page, because those requests are never rated.