Audit Logs
Last updated: August 28, 2026
Audit logs provide a complete record of every read, write, and page view across Housing.Cloud. Events are retained for 365 days and can be searched, filtered, and exported for compliance reviews, troubleshooting, and activity monitoring.
Administrators use audit logs to investigate who made specific changes, when actions occurred, and what data was affected. The audit log page captures both user-initiated actions and automated system events.
Access the audit logs page
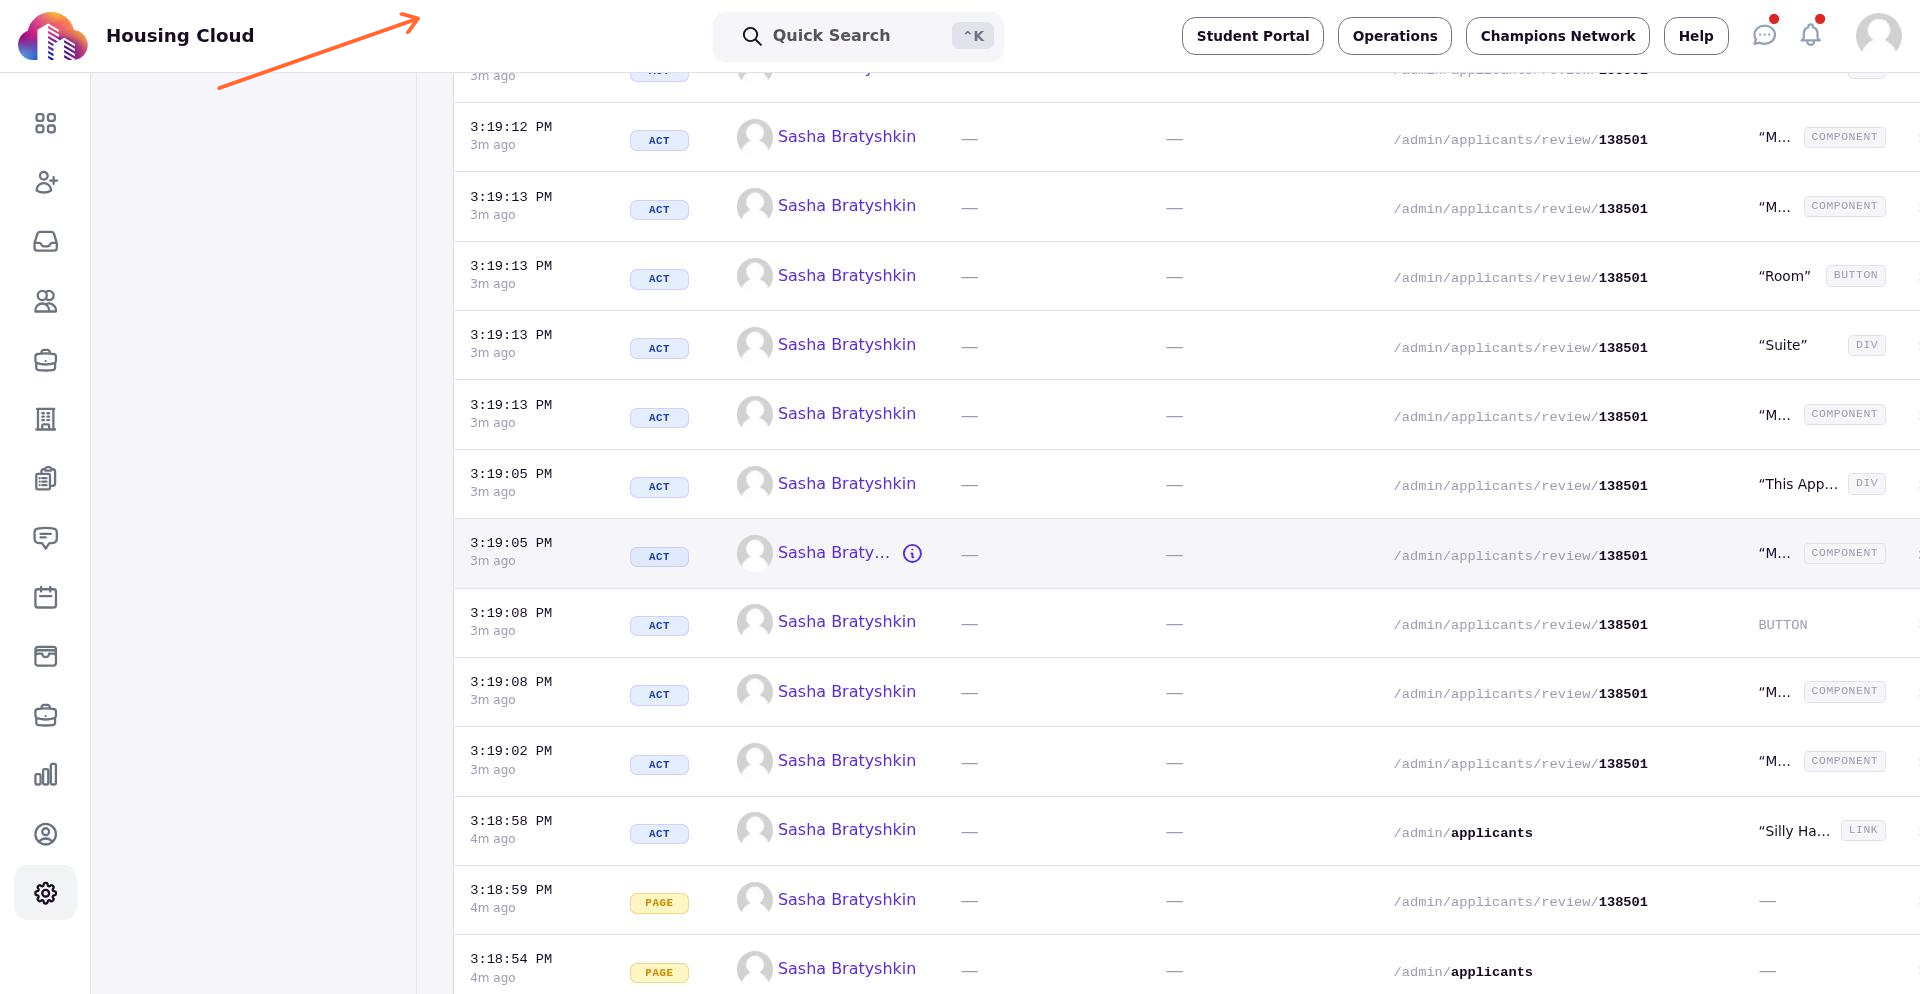
The audit logs page is located in the admin portal under Setup. Access requires the appropriate permissions; if you cannot view the page, contact your administrator to enable audit log access for your role.
Navigate to Setup and select Audit logs to open the audit log viewer.
Filter audit events
The filter bar at the top of the page lets you narrow the event list by actor, type, time range, and other criteria. Filters combine to further refine results; for example, you can filter to show only Write events by a specific actor within the last 24 hours.
Actor filter
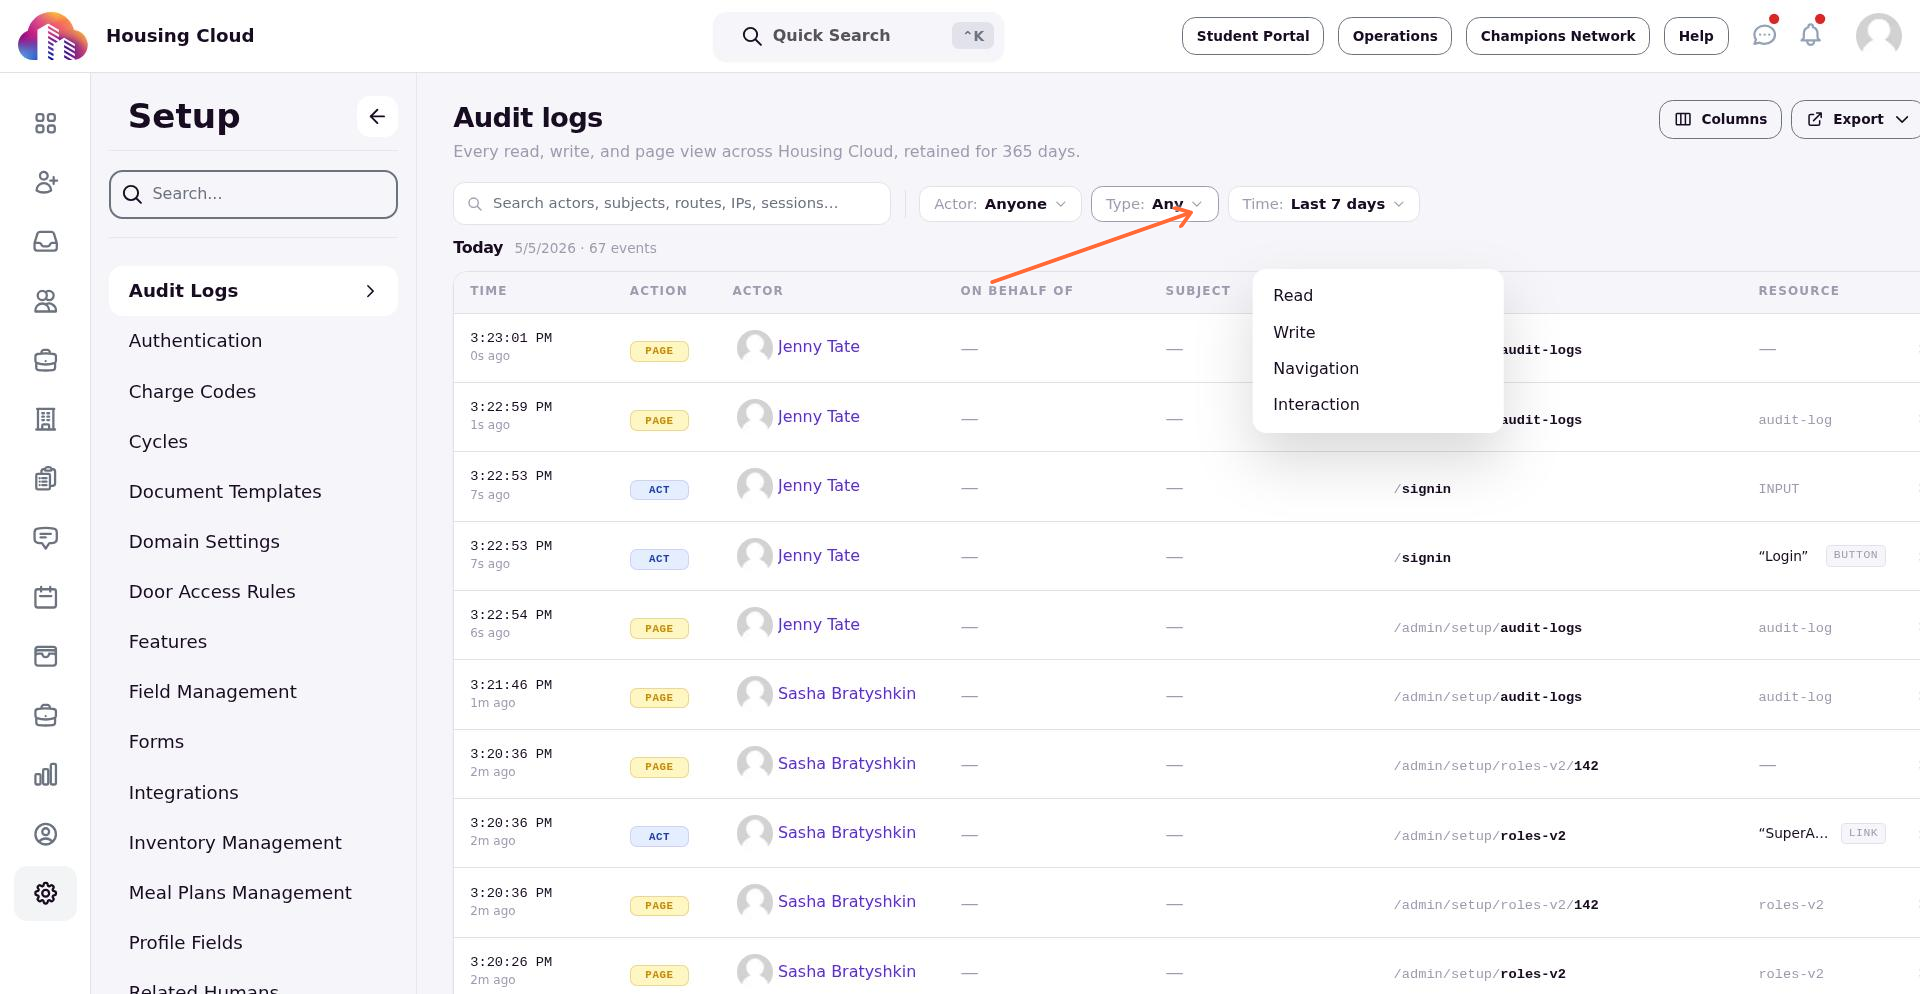
The Actor filter shows events triggered by a specific user. Select Anyone to remove the actor filter and show events from all users.
Type filter
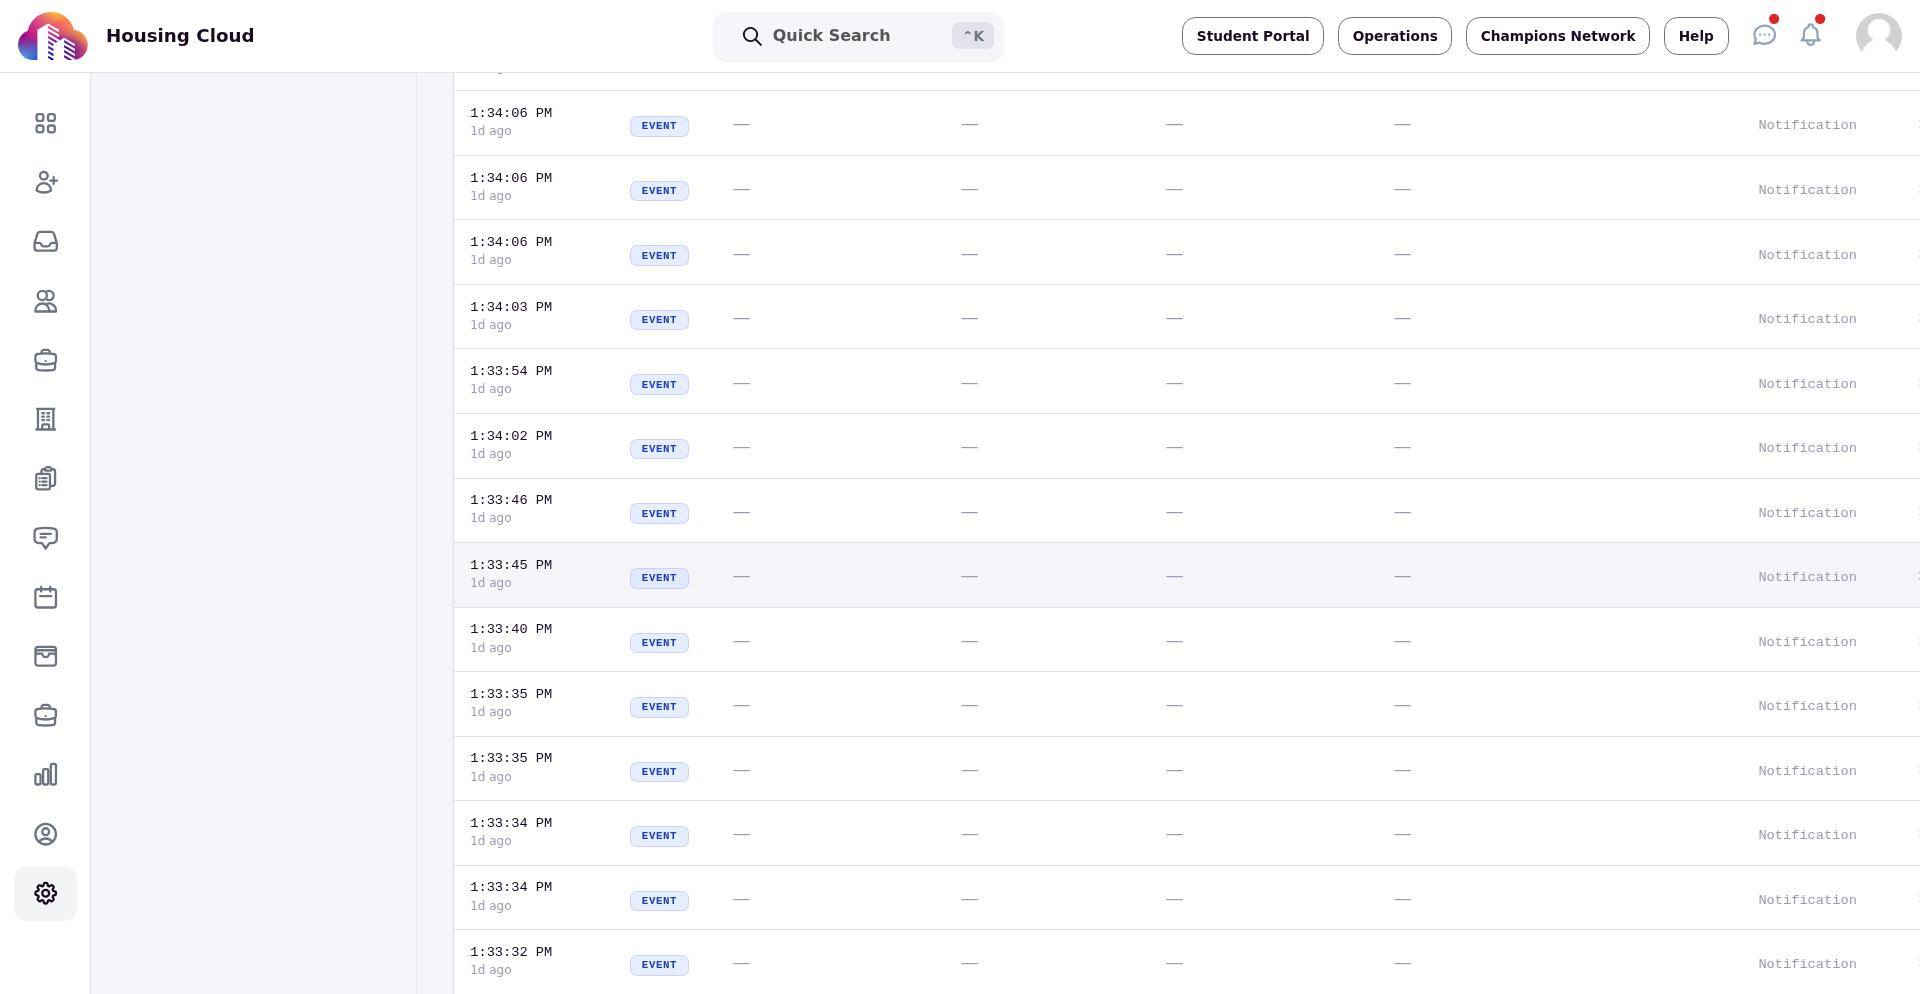
The Type filter categorizes events by their classification:
- Read — View actions, such as loading a profile or opening a page
- Write — Modify actions, such as creating, updating, or deleting records
- Navigation — Page transitions and route changes
- Interaction — User interface interactions, such as button clicks or form submissions
Time filter
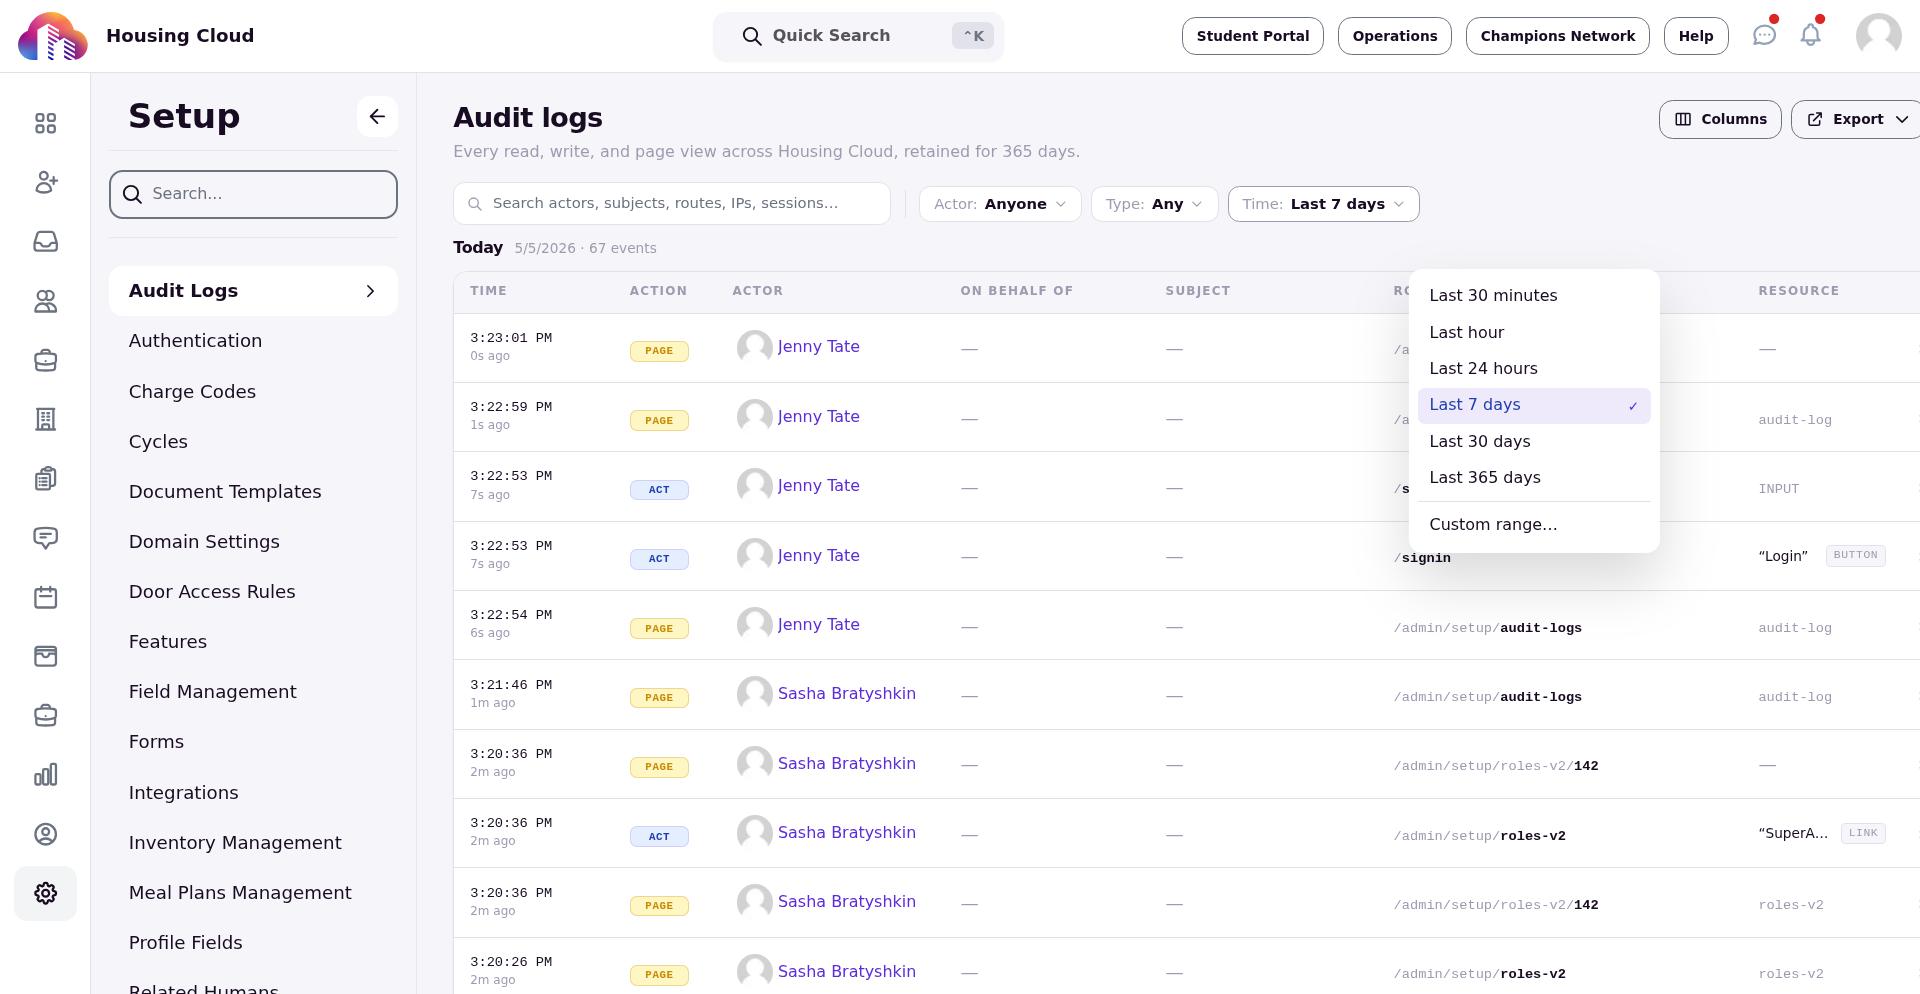
The Time filter limits results to a specific window. Preset options include:
- Last 30 minutes
- Last hour
- Last 24 hours
- Last 7 days
- Last 30 days
- Last 365 days
- Custom range — Select specific start and end dates
The default view shows events from the last 7 days. For broader searches, select a longer time range or use the custom range option.
Search
The search box filters across actors, subjects, routes, IP addresses, and session IDs. Use search to locate events without knowing the exact filter values.
Source filter (developer access only)
Users with developer access see an additional Source filter that distinguishes between Frontend events (triggered by the user interface) and Backend events (triggered by server-side processes). This filter is hidden for non-developer accounts.
Understand the audit log table
The audit log table displays events in chronological order, grouped by day. Each row represents a single auditable event. Select any row to open the detail drawer and view complete event information.
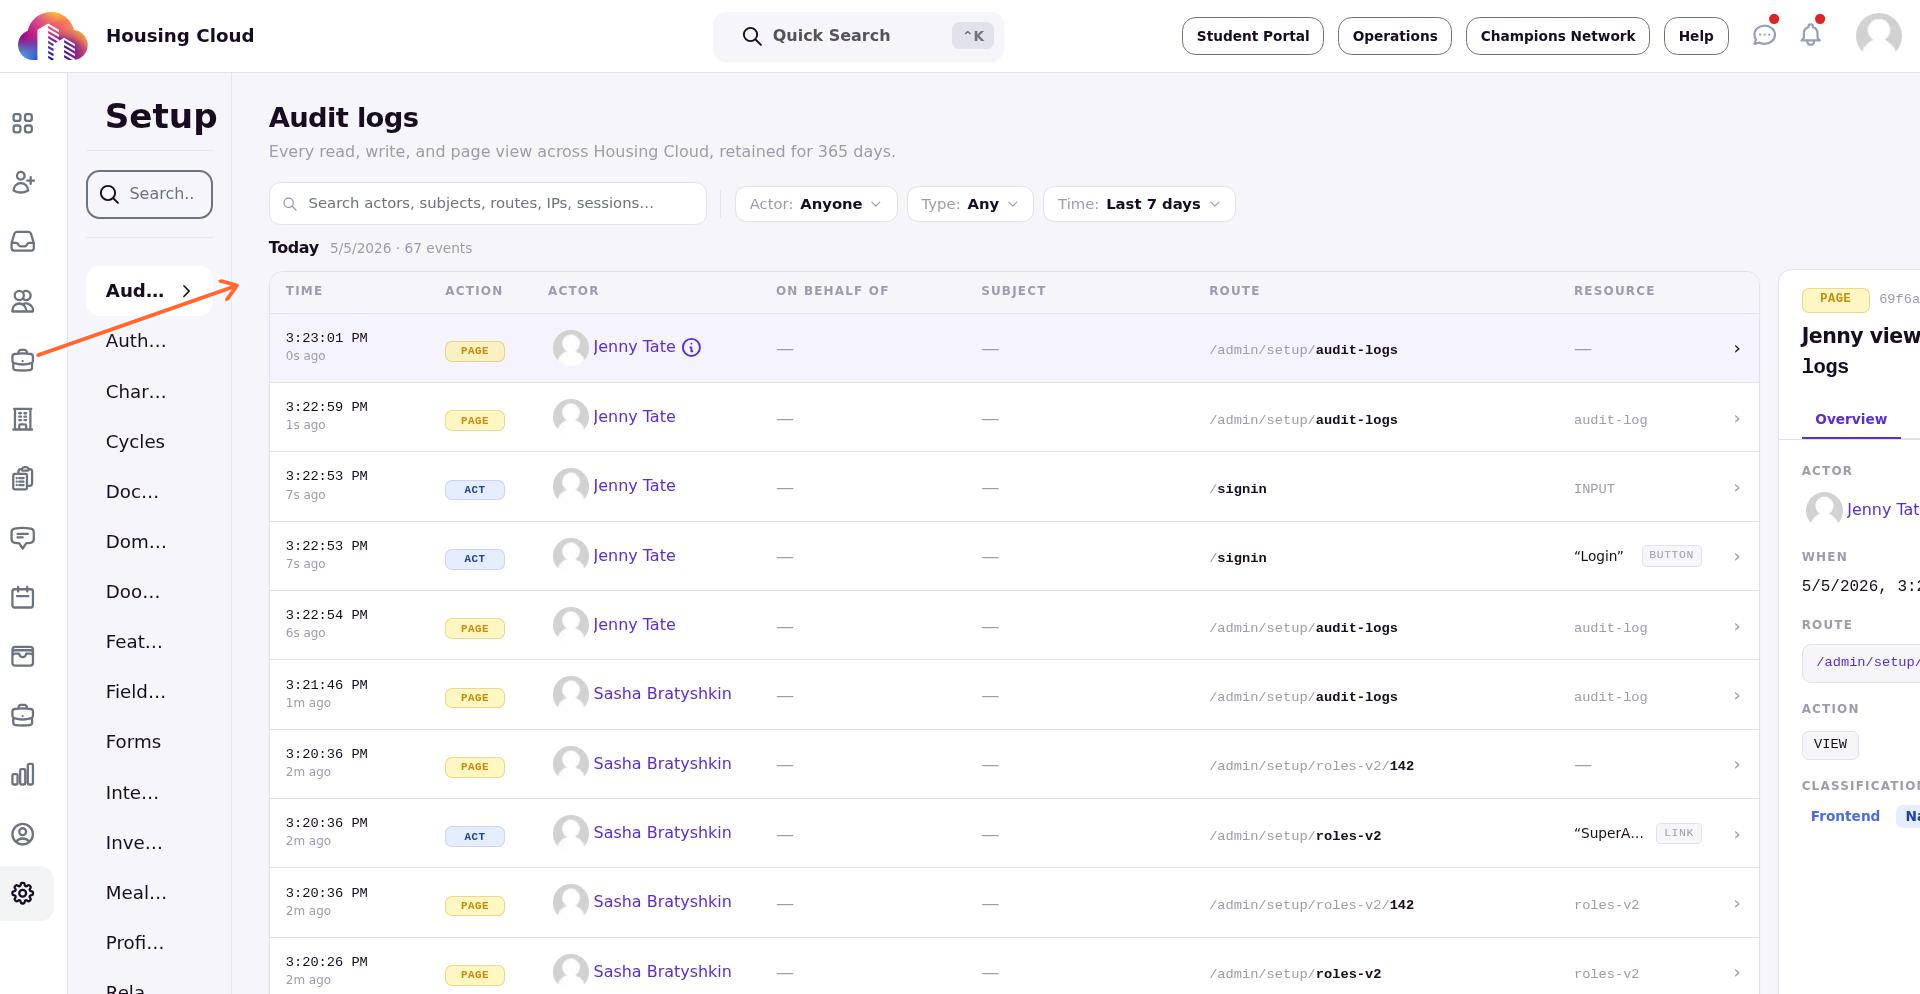
Default columns
By default, the table shows the following columns:
- Time — When the event occurred, displayed in your local timezone
- Action — The specific action taken, such as user.created or application.submitted
- Actor — The user who triggered the event. For impersonated actions, this shows the real administrator who initiated the action.
- On behalf of — The impersonated user, if applicable. When an administrator acts on behalf of another user, the impersonated user appears here. This column is empty for direct actions.
- Subject — The user affected by the event. This differs from the actor when the action targets another user's data.
- Route — The tRPC procedure or application path involved in the event. Safe app paths appear as clickable links; unsafe or internal paths display as plain text.
- Resource — The resource type involved, such as Profile, Application, or Residency, along with any relevant interaction label.
Show additional columns
The Columns button opens a column picker with additional fields organized into groups:
- Identity — Actor, On behalf of, Subject
- What happened — Action, Route, Source
- Resource — Resource, Resource ID
- Diagnostic — Session ID, IP address, User agent
Enable additional columns to trace events across sessions, identify IP addresses, or view the browser and device information for specific actions.
View event details
Select any row in the audit log table to open a detail drawer on the right side of the screen. The drawer shows complete information about the event across three tabs.
Overview tab
The Overview tab summarizes the event with key details:
- Actor — Who triggered the event
- On behalf of — The impersonated user, if applicable
- When — The exact timestamp of the event
- Route — The tRPC procedure or path
- Resource — The resource type and identifier
- Action — The specific action classification
- Classification — Whether the event was Read, Write, Navigation, or Interaction
- Outcome — Whether the action succeeded or failed
Payload tab
The Payload tab shows the data involved in the event:
- Input — The data sent to the server for the action
- Result — The data returned by the server
Not all events record payload data. If no input or result was captured, the drawer displays a message indicating that no payload is available.
Context tab
The Context tab provides diagnostic information about the event environment:
- Source — Whether the event originated from Frontend or Backend
- Page — The page where the event occurred
- Session ID — The user's session identifier
- View ID — The view instance identifier
- IP address — The client IP address
- User agent — The browser and device information
Export audit logs
The export controls in the page header let you download audit log data for offline analysis or compliance reporting. Select Export as CSV or Export as Excel to request an export.
Exports process asynchronously. When you request an export, the system prepares the file in the background and sends you a notification when it is ready for download. This approach allows large exports to complete without blocking your session.
Exports respect your current filter settings. Configure your filters before exporting to limit the exported data to the events you need.
Empty and loading states
If no events match your filters, the table displays a message indicating that no matching audit events were found. Try widening the time range or clearing filters to broaden your search.
When the page is loading events, you see a loading indicator. For large result sets, use the Load more button at the bottom of the table to fetch additional events.
Where audit logs appear elsewhere
Individual records across Housing.Cloud include Activity tabs that show audit history specific to that record. For example, a profile's Activity tab displays changes made to that profile, and a residency's Activity tab shows changes specific to that residency. These focused views pull from the same audit log data but are scoped to a single record.
For a complete view of all activity across the system, use the audit logs page described in this article.