Reports Overview
Last updated: August 28, 2026
Reports is Housing.cloud’s no-code reporting tool. It pulls together information from across your housing operations — residents, applications, room assignments, keys, and more — and shows it as a live table or chart, without writing code or queries. You can run a ready-made report, build your own, and share, schedule, or export the results. This article explains how Reports is organized and how a report is put together, then points you to the right article for each task.
What You Can Do with Reports
- Run pre-built reports that come with Housing.cloud.
- Build your own report from your housing data.
- See results as a table or a chart.
- Share reports with people and roles, and control who can edit them.
- Schedule reports to run and email automatically.
- Export results to a spreadsheet.
- Organize reports into folders, archive them, and restore earlier versions.
Reports has two main areas: the library, where you find and manage reports, and the builder, where you create and change them.
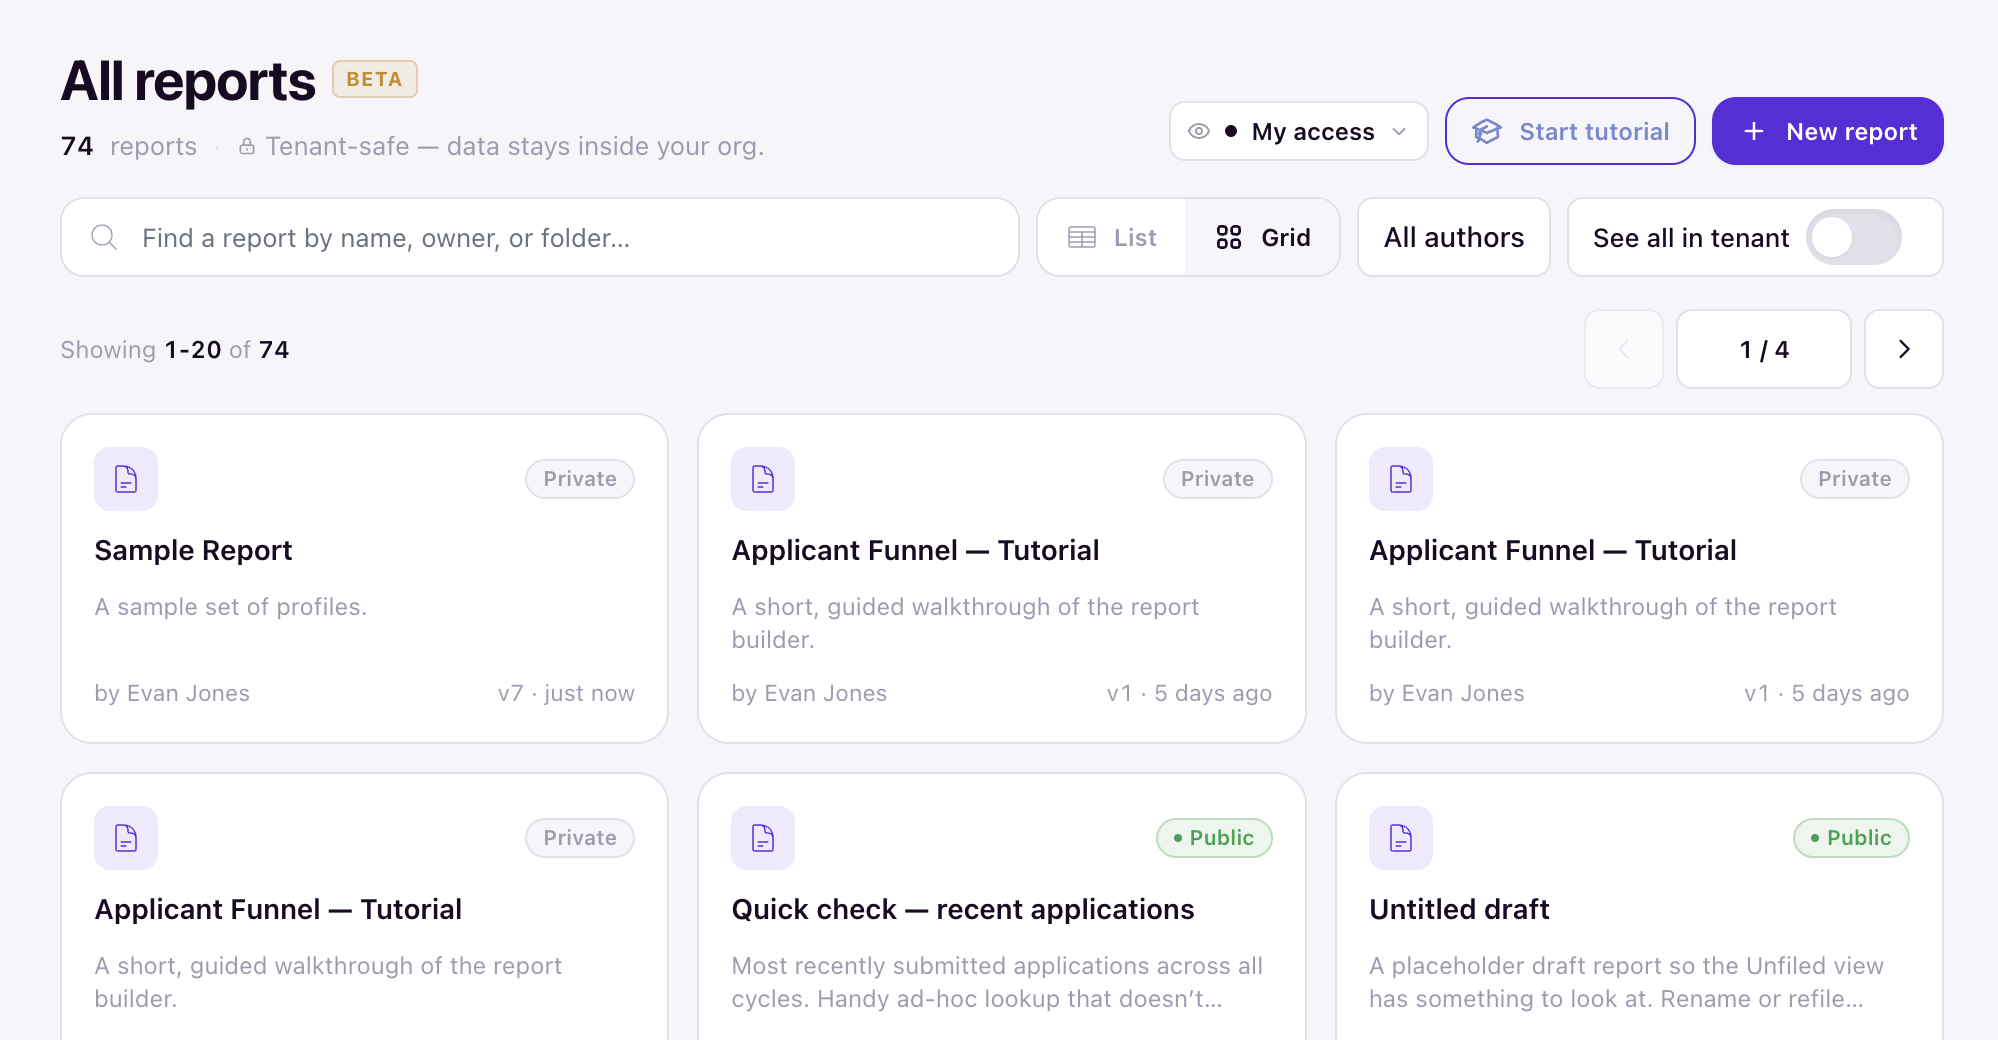
The Library
The library is your starting point — a list of every report you can access. From here you find, open, run, and manage reports: browse folders, search by name, owner, or folder, pin the reports you use most, and reach archived items. See Find Reports in the Library.
The Builder
Open the builder to create a new report or change an existing one. It has three areas that take you from raw data to finished results.
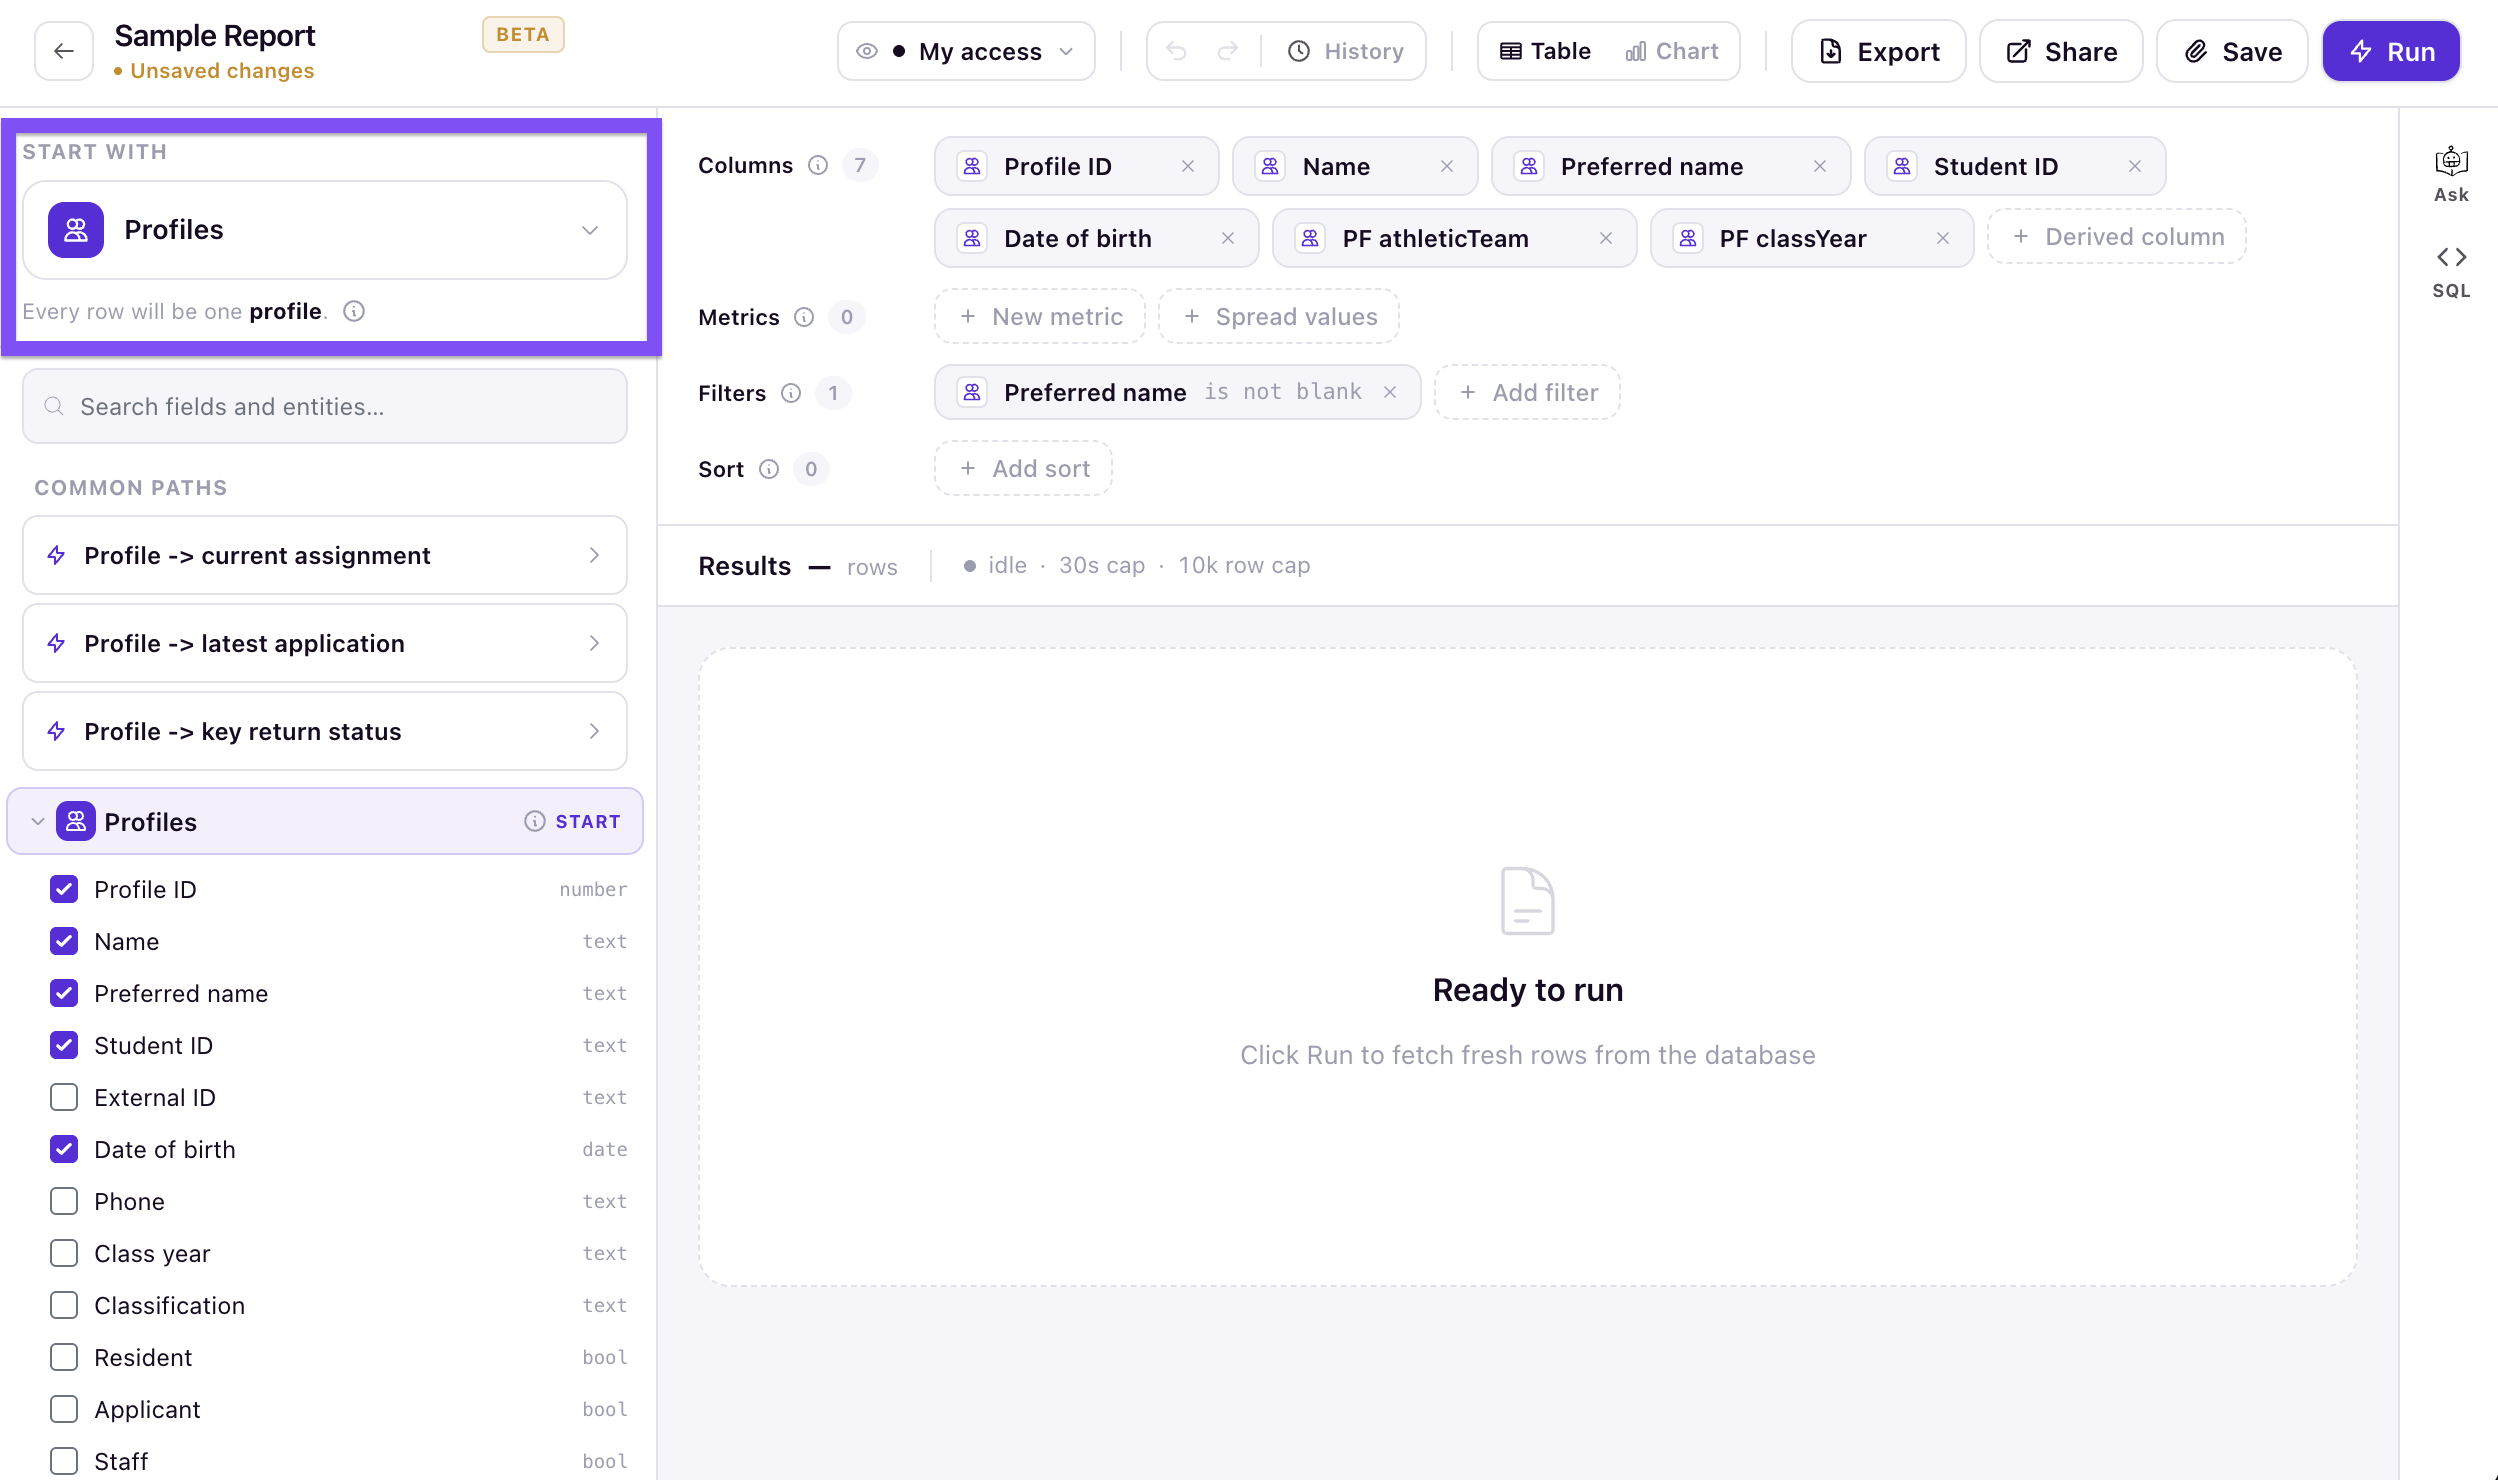
Data Panel
Choose the primary data point that serves as the report’s starting point.
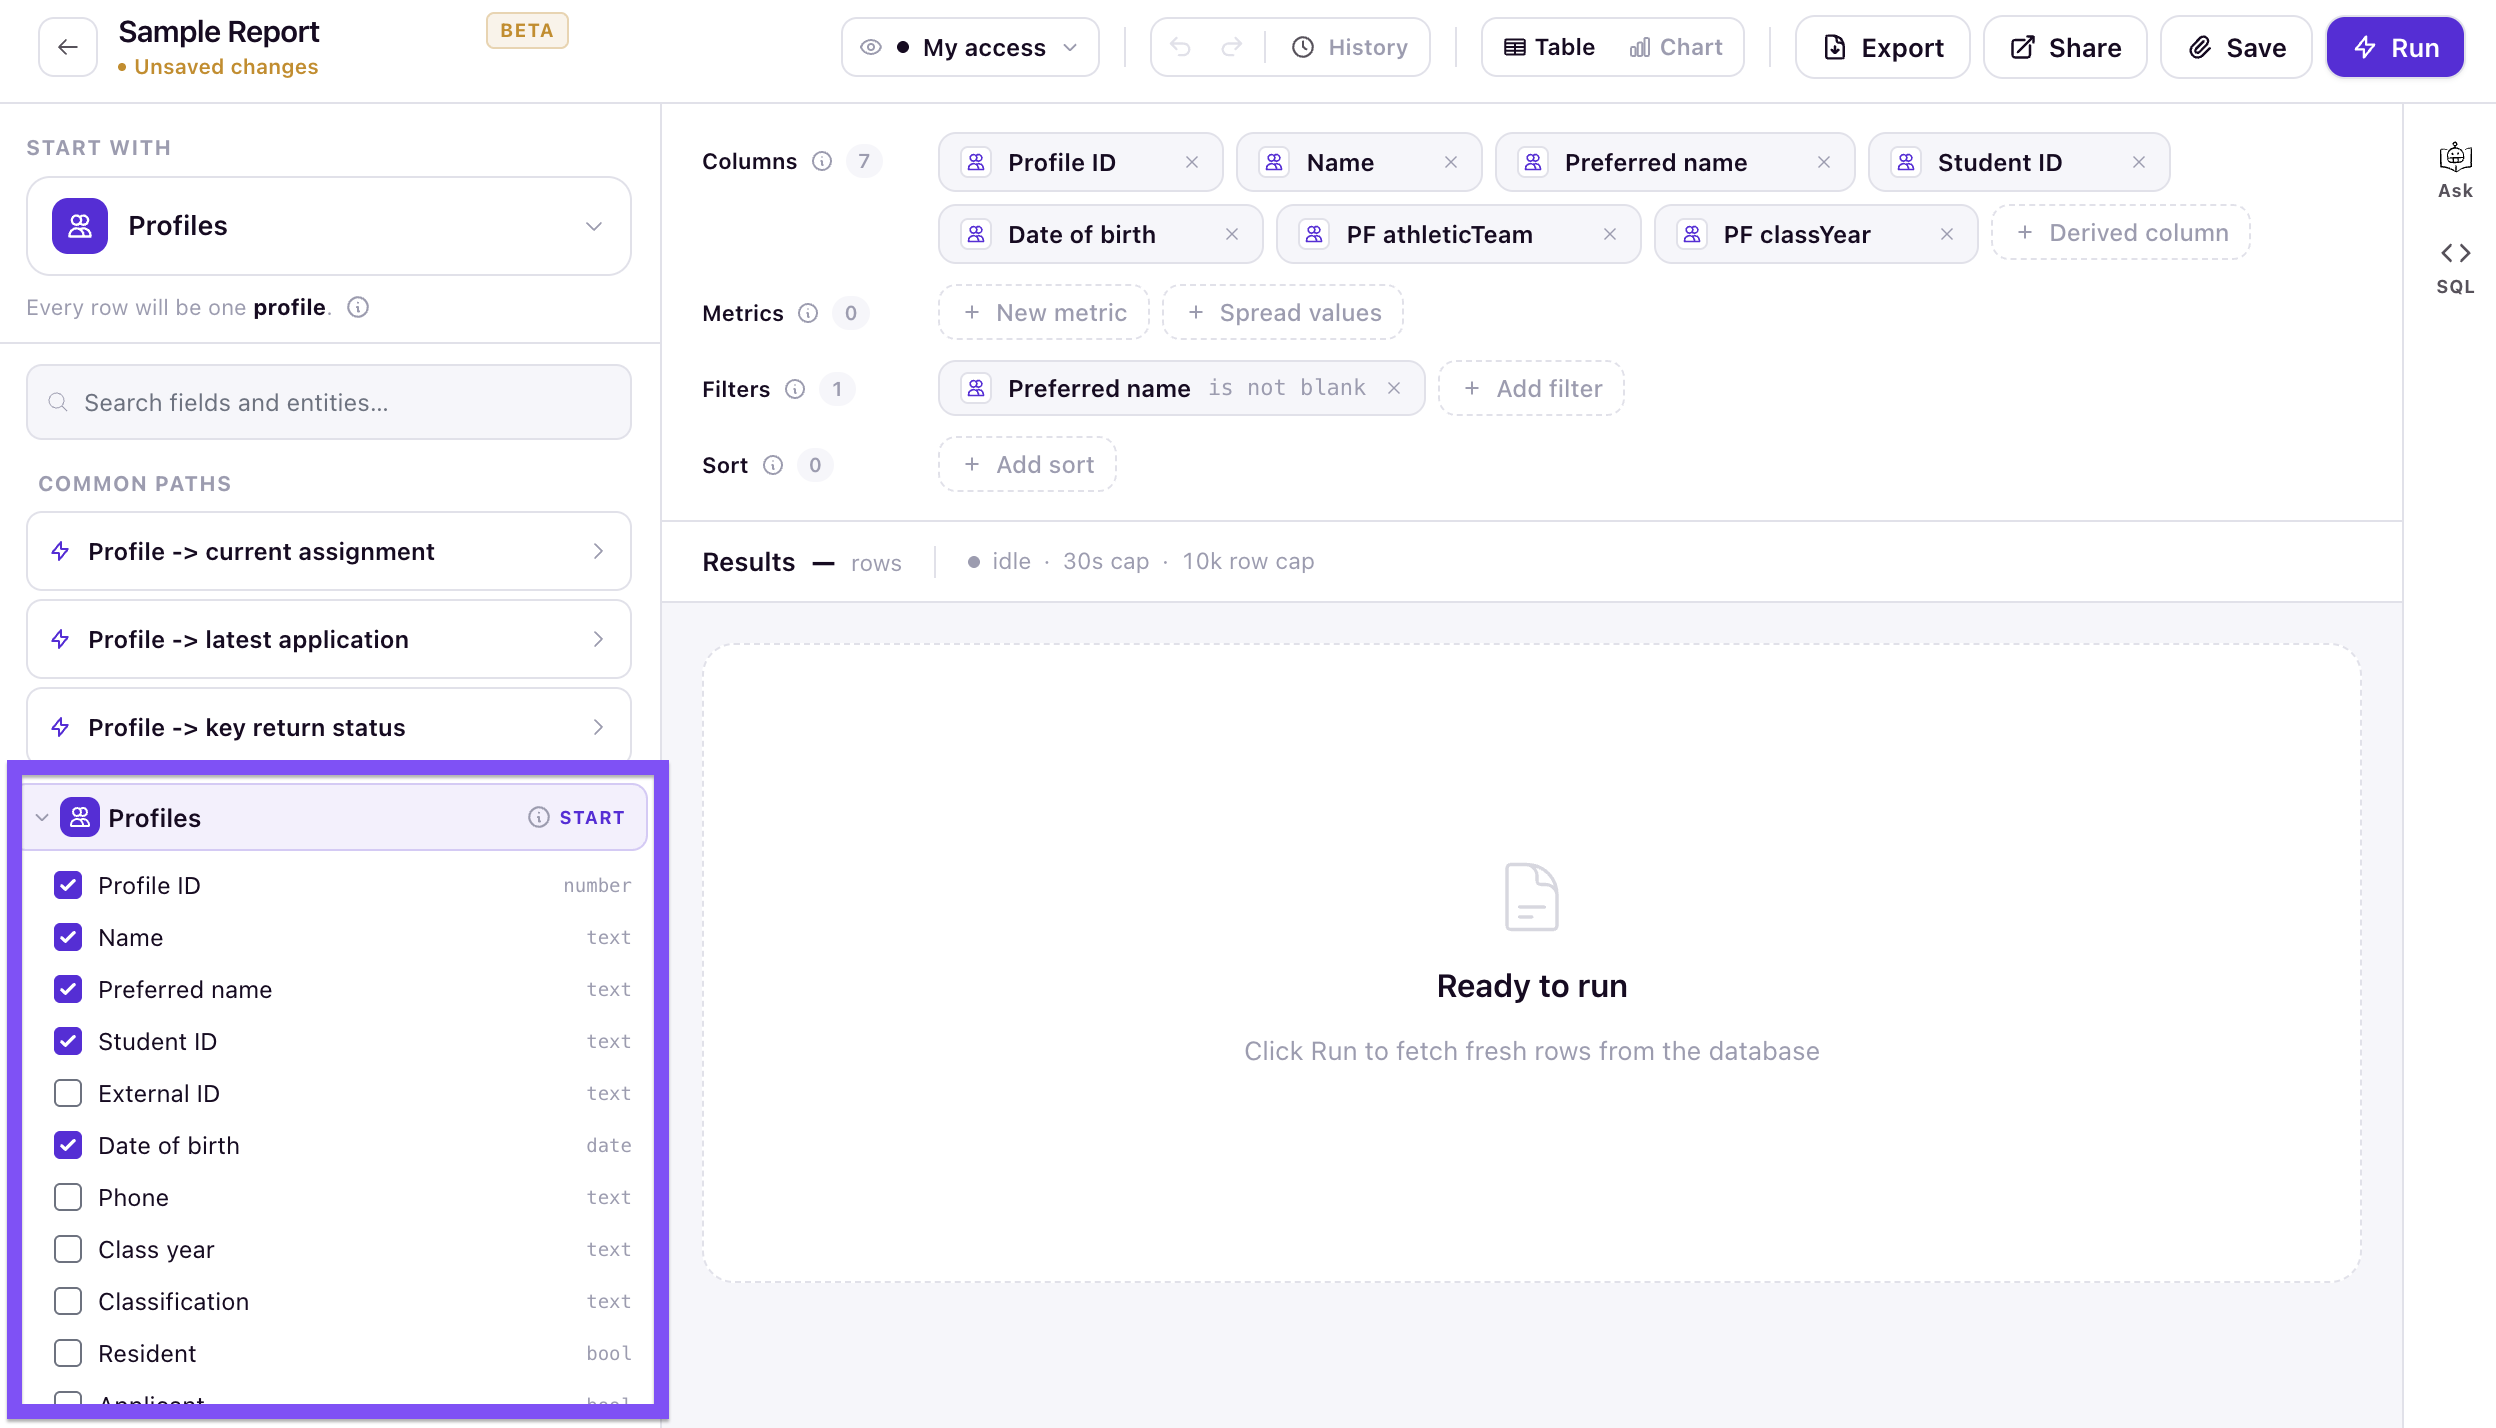
Then pick the fields and related data to include.
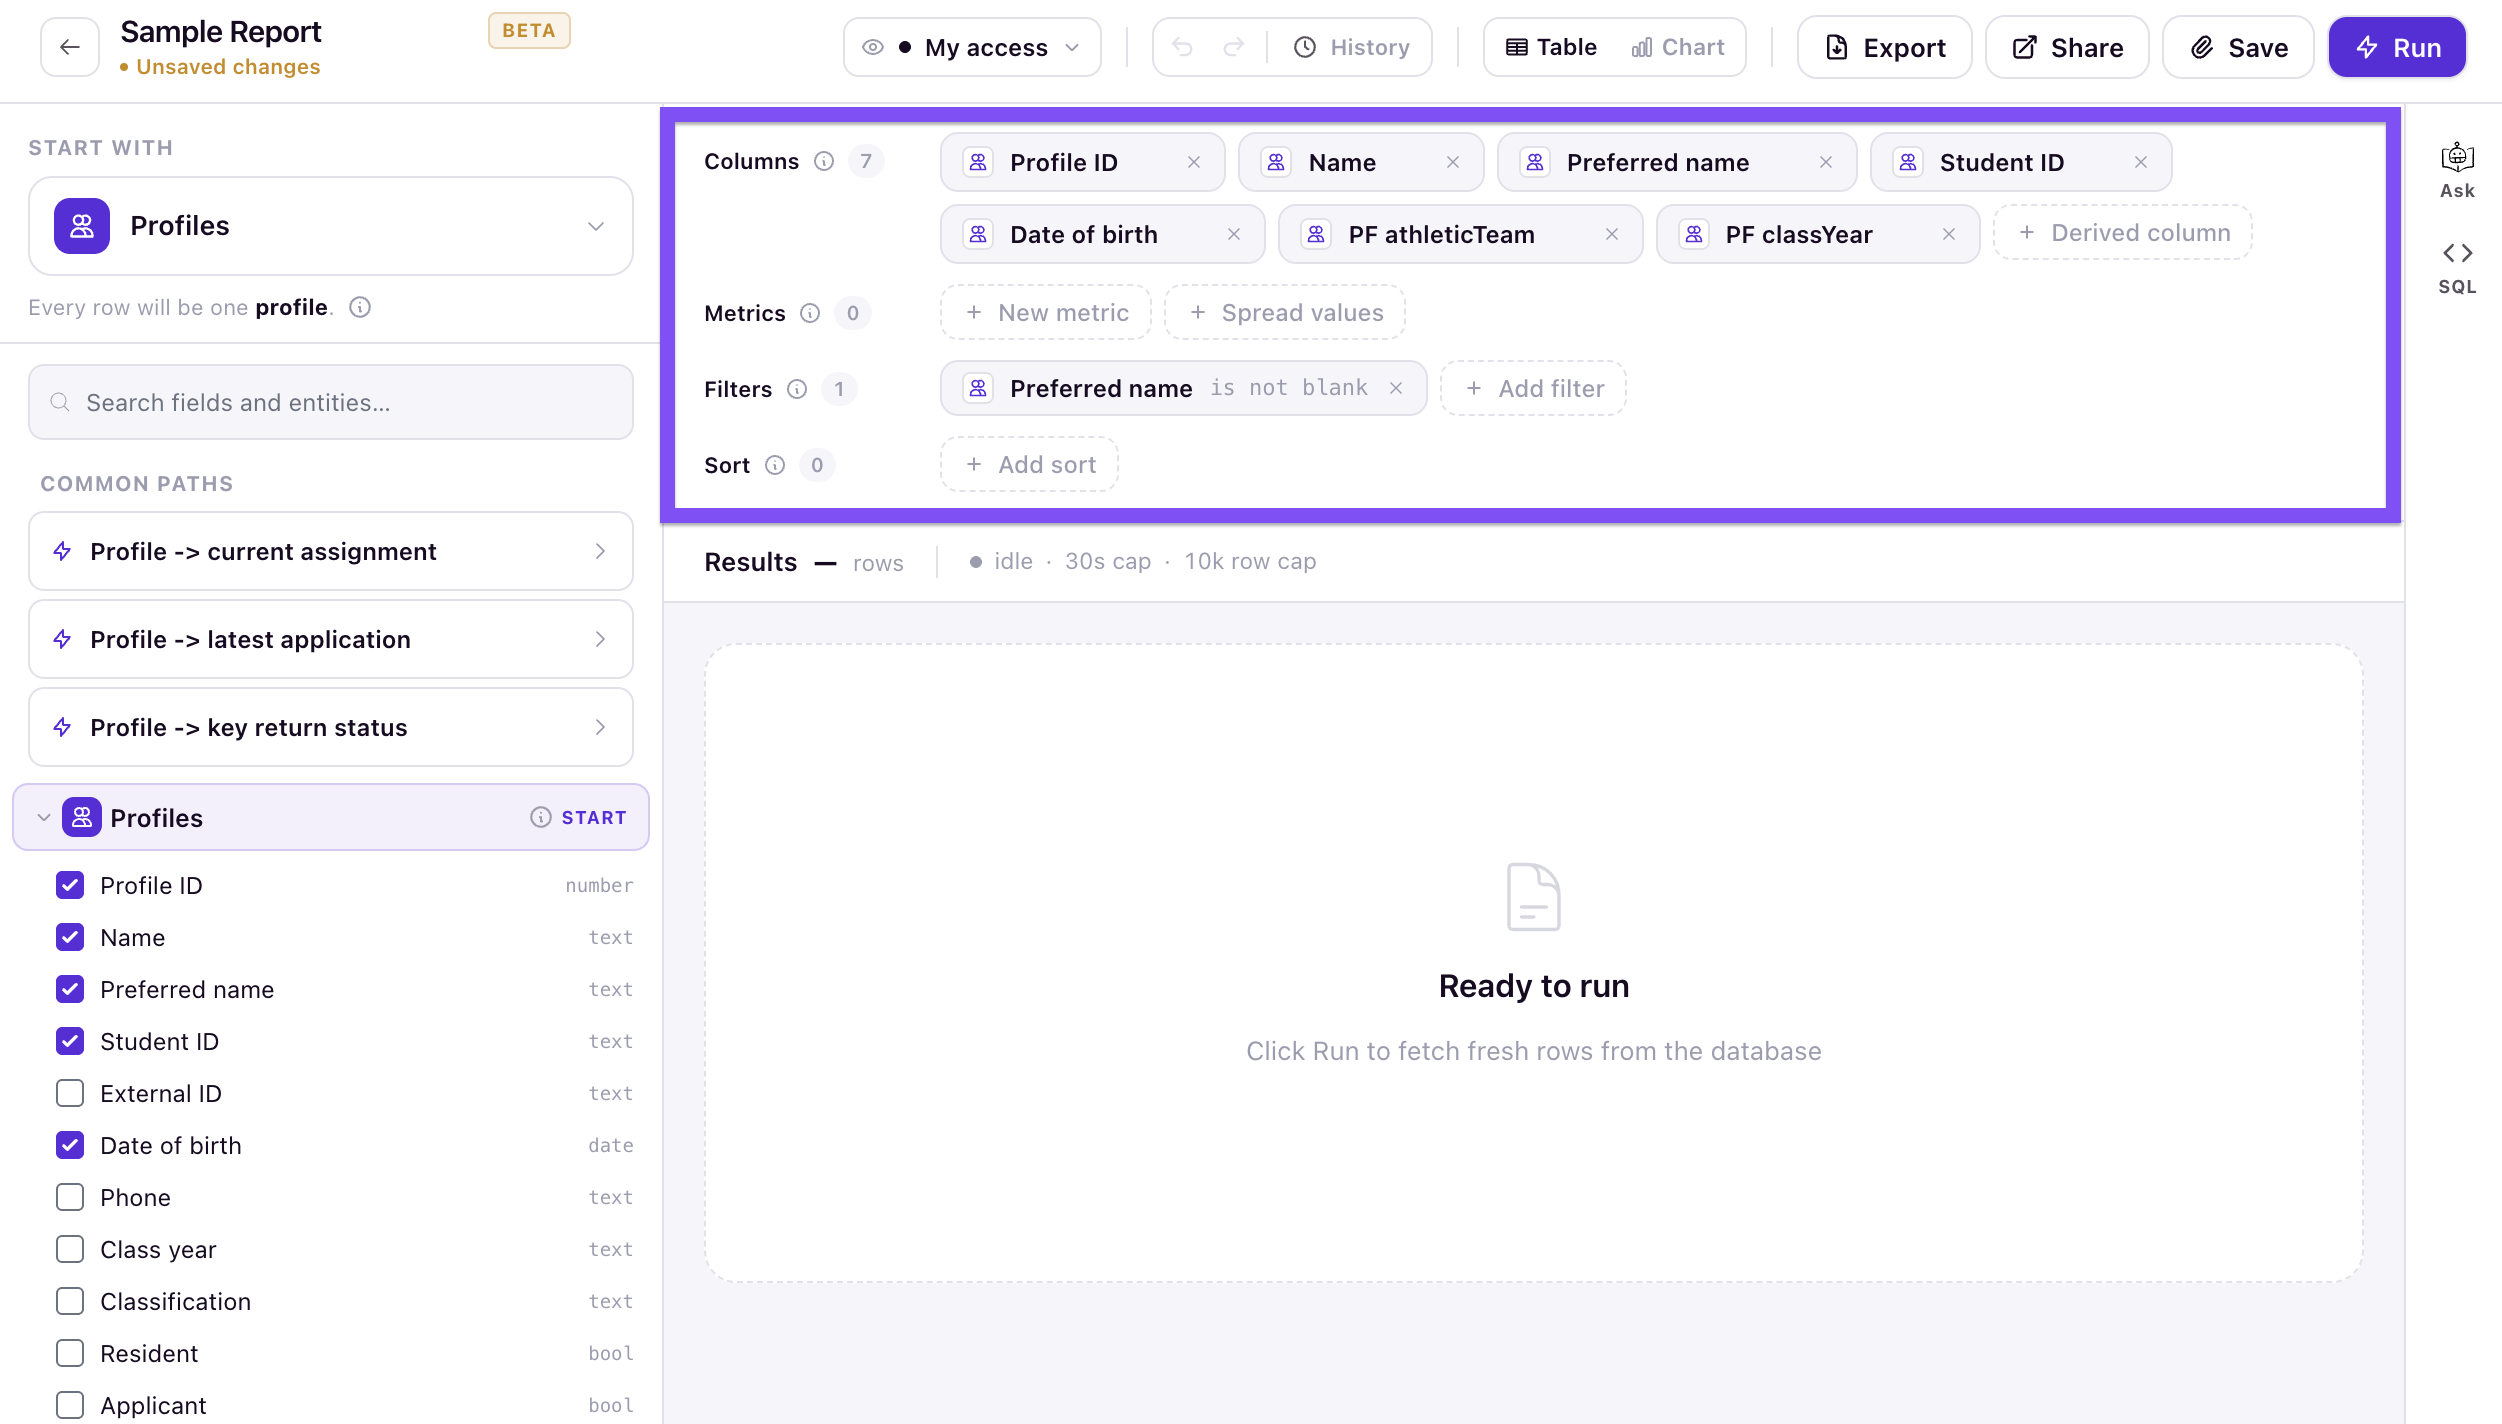
Config Rail
Add columns, metrics, filters, and sort, plus an optional chart. The builder warns you when a setup won’t return valid results.
Results Panel
Shows the live grid when you run the report.
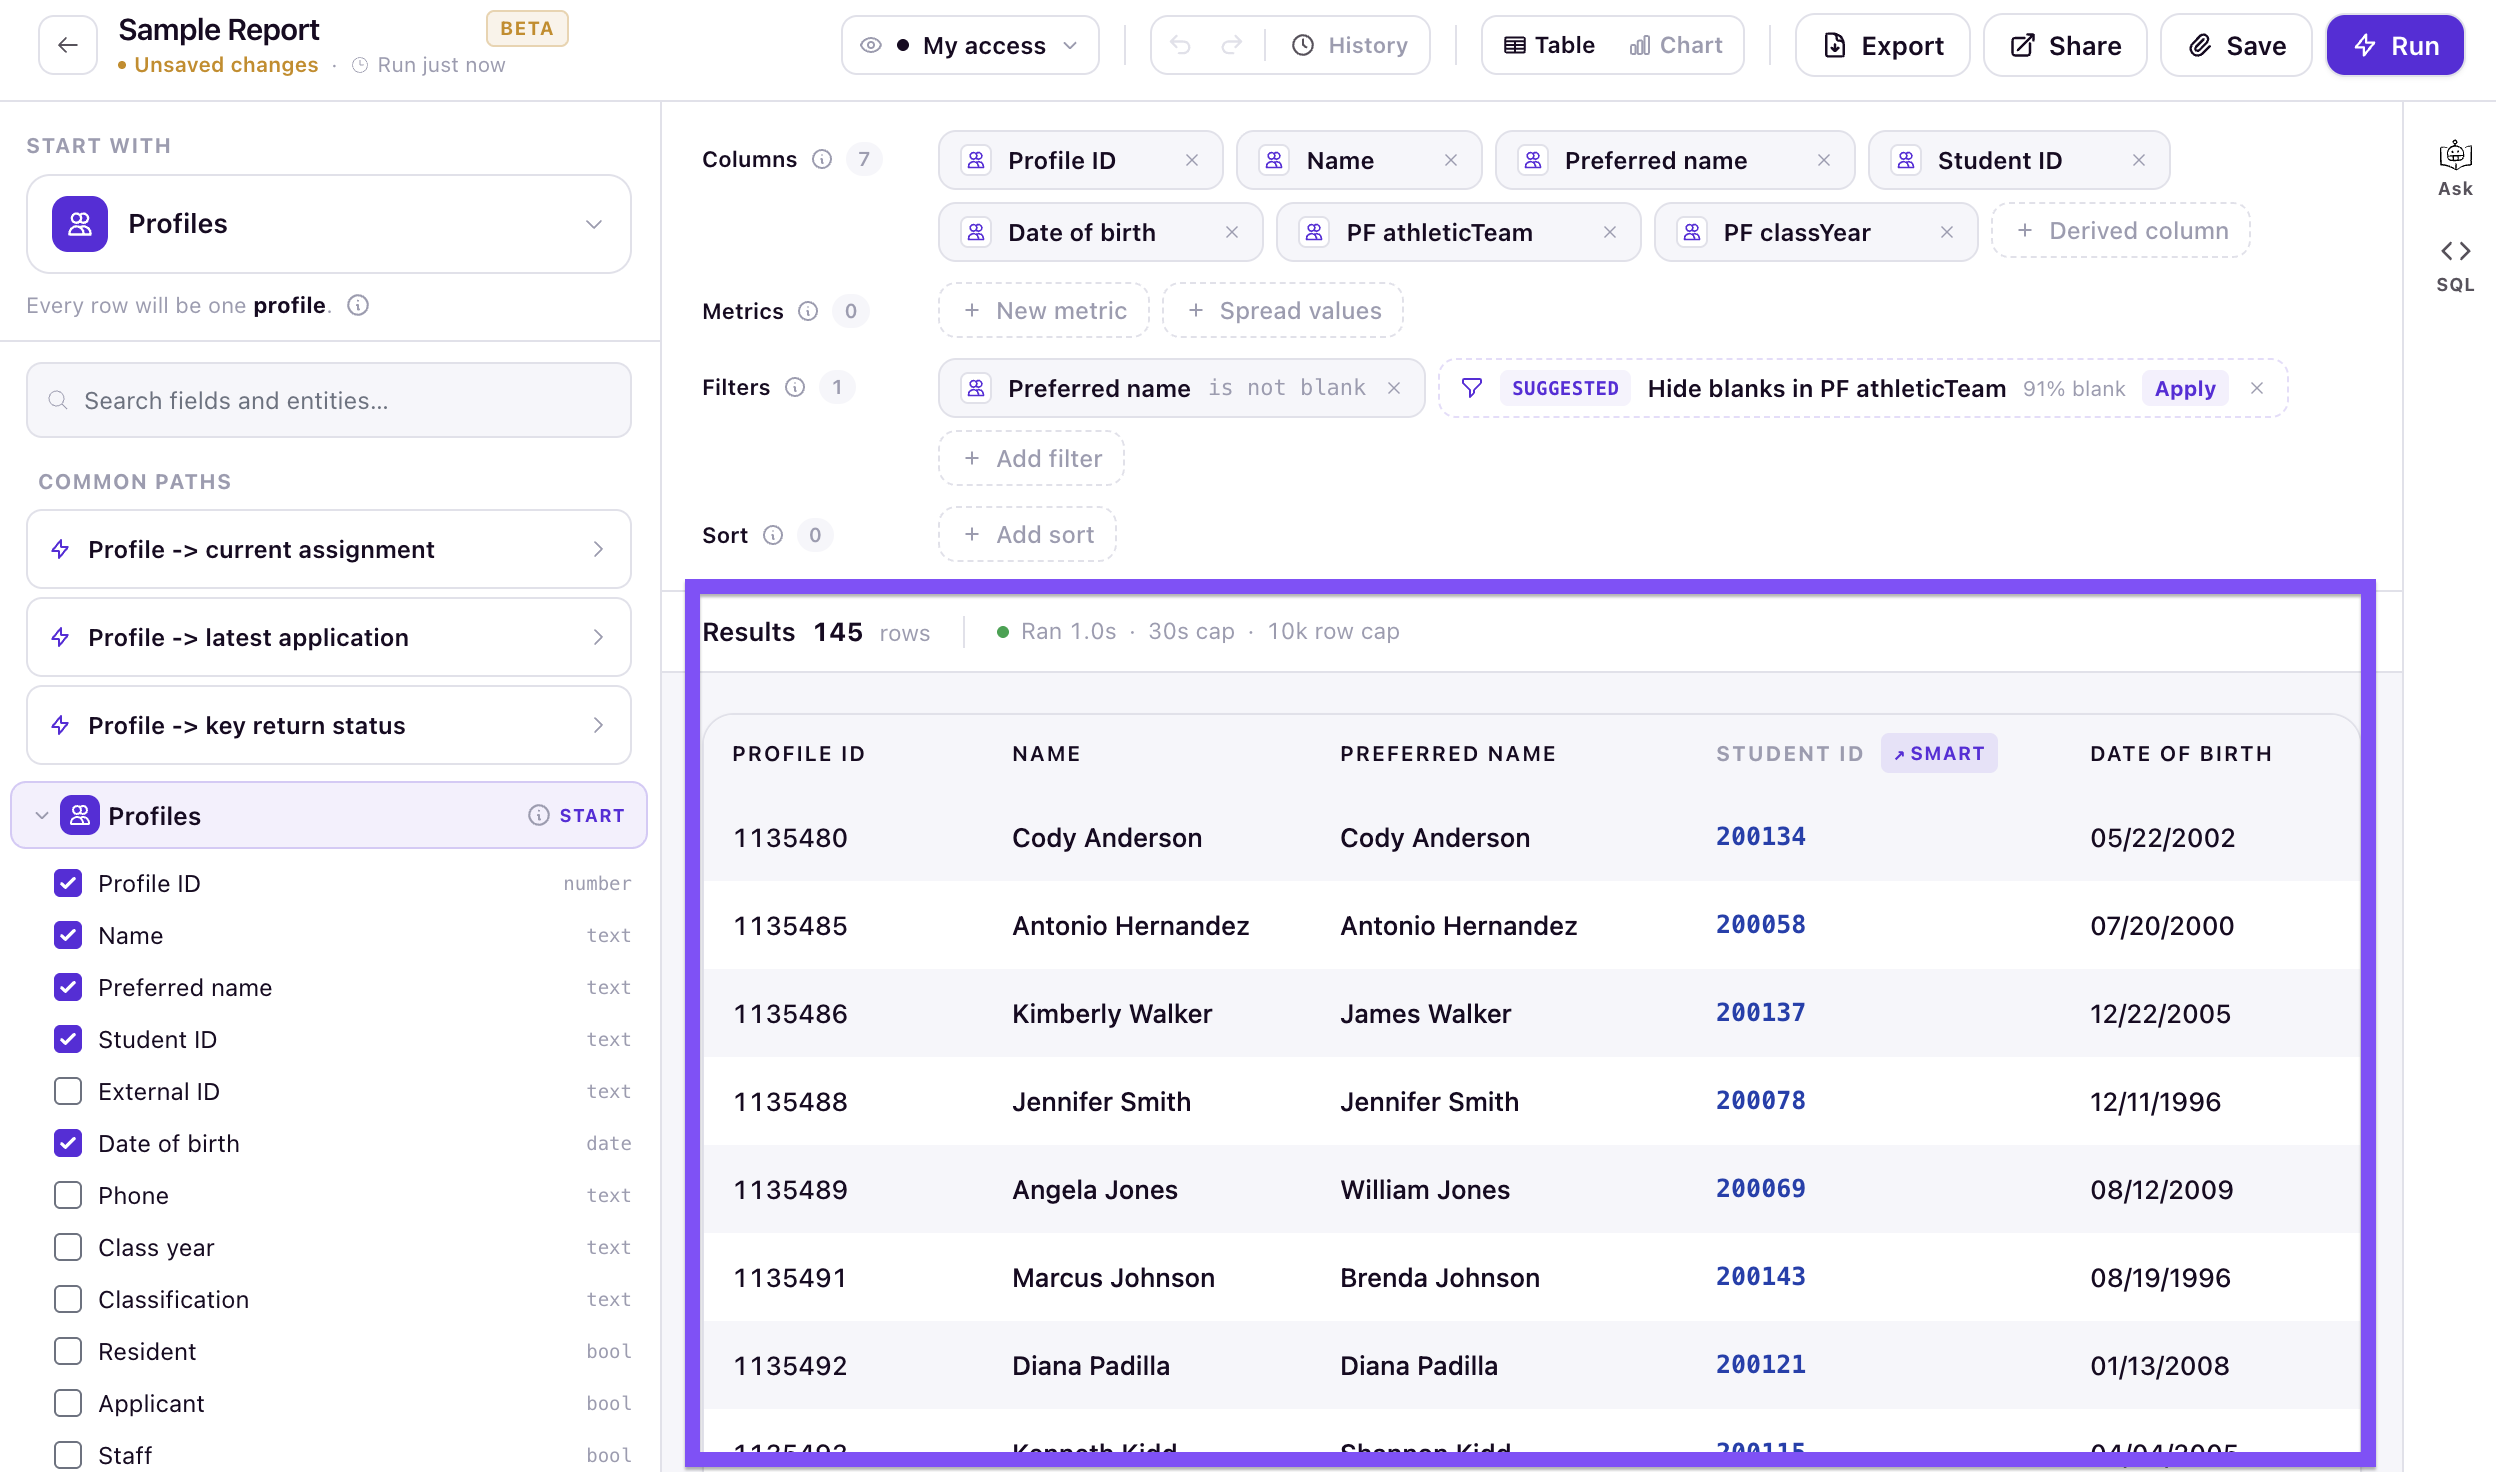
For step-by-step instructions, see Build a Report.
How a Report Is Built
Every report follows the same shape, and understanding it makes the builder much easier to use.
Start with What the Report Is About
Every report begins by choosing a starting point with Start with — the entity the report is about. You can pick any entity as the basis: Profiles (people and residents), Applications, Residencies, Keys, Cycles, and more. Every row in the results is one of these records — for example, one row per resident, or one row per application.
Pull in Related Data
From the starting point, you reach outward to related data that connects back to it — for example, from a resident to their room assignments or their application. You then add the fields you want as columns. A chip on each related connection controls which related records come along:
- All — include every related record.
- Current — include only records active as of today.
- Latest — include only the single most recent record per item.
Add Columns, Metrics, and Filters
- Columns — the fields shown for each row.
- Metrics — calculated summary values, such as a count of approved applications or an occupancy rate.
- Filters — rules that limit which rows appear.
- Chart — an optional visual layer on the same report.
Note: Because one starting record can have many related records, rows can repeat — one resident appears several times if they have several assignments. Use Summarize rows to combine the repeats into one row per record. This is covered in Build a Report.
Run a Report and Read the Results
Running a report shows live results in the grid. A report returns at most 10,000 rows. See Run a Report and Read the Results.
Caution: If more than 10,000 records match, you see the first 10,000 and a truncation warning — and an export includes only the rows shown. Narrow the report with filters to stay within the limit.
Share, Schedule, and Export
Once a report is useful, you can get it to the right people:
- Share it with specific people, with roles, or with everyone in your organization, and set whether they can view or edit. See Share Reports and Control Access.
- Schedule it to run and email on a recurring basis. See Schedule Reports.
- Export the results to CSV or XLSX. See Export a Report.
Organize and Version Reports
Use folders, pinning, and archiving to control what appears in the library, and use versions to track changes over time so you can restore an earlier definition. See Organize Reports: Folders, Pin & Archive and Report Versions: History & Restore.
New to Reports?
Click Start tutorial in the library for a guided walkthrough that builds a real report you’ll own. See Take the Guided Tutorial.
Find the Right Article
- Find and open a report — Find Reports in the Library
- Run a report and read results — Run a Report and Read the Results
- Create or change a report — Build a Report
- Share and set permissions — Share Reports and Control Access
- Schedule recurring runs — Schedule Reports
- Download results — Export a Report
- Folders, pinning, archiving — Organize Reports: Folders, Pin & Archive
- Restore a previous version — Report Versions: History & Restore
- Take the guided walkthrough — Take the Guided Tutorial
- Fix an error or warning — Troubleshoot Report Errors and Warnings